1
$\begingroup$

I am trying to analyse the interaction between level of class (either upper class or lower class) and level of prejudice attitudes. I have hypothesized that upper class individuals shall have higher levels of prejudice due to eliciting more essentialist beliefs. I am using the Essentialist Belief Scale, the Modern Racism Scale and the Modern Sexism Scale.

What statistical test should I be running?

I thought it could be a $t$-test or a regression but I am not entirely sure which one to use and why.

$\endgroup$
4
  • $\begingroup$ What kind of data do you have? $\endgroup$
    – whuber
    Commented Nov 11, 2015 at 15:05
  • $\begingroup$ I have no data at the moment just trying to assess how to analyse this hypothesis $\endgroup$
    – KEA
    Commented Nov 11, 2015 at 15:17
  • $\begingroup$ That's a good idea. But before you can even think about a statistical test you need to have some sense of what data you can collect! $\endgroup$
    – whuber
    Commented Nov 11, 2015 at 15:19
  • 1
    $\begingroup$ @KEA, It is good to see a question about statistical methodology asked so early in the course of research! Ronald Fisher famously said, "To consult the statistician after an experiment is finished is often merely to ask him to conduct a post mortem examination. He can perhaps say what the experiment died of." $\endgroup$ Commented Nov 11, 2015 at 20:35

2 Answers 2

1
$\begingroup$

@KEA, you are clearly developing causal hypotheses, and I wonder if you have considered diagramming them using directed acyclic graphs (DAGs). For example, just reading your original post, and adding some imagination about what data you might collect, I'm led to sketch the following causal diagram: An example of a causal diagram for your research question
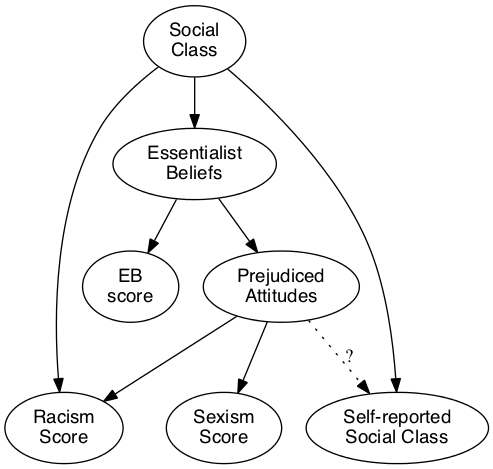
Your own diagram of your hypotheses may be quite different from this. But I'll wager that no sooner will you have drawn your own causal diagram than you will see that your research question is genuinely nontrivial, and cannot possibly reduce to a handful of null hypothesis tests.

FYI: This diagram is made using the DOT language, like so:

digraph g {
  node [fontname="Helvetica"]
  SC [label="Social\nClass"]
  EB [label="Essentialist\nBeliefs"]
  PA [label="Prejudiced\nAttitudes"]
  EBS [label="EB\nscore"]
  MRS [label="Racism\nScore"]
  MSS [label="Sexism\nScore"]
  SRSC [label="Self-reported\nSocial Class"]
  SC -> EB -> EBS
  EB -> PA
  PA -> MRS
  SC -> MRS
  PA -> MSS
  PA -> SRSC [style="dotted", label="?"]
  SC -> SRSC
}
$\endgroup$
0
$\begingroup$

Are you measuring class as simply a dichotomous variable (upper or lower are the only possible values)? If so, the simplest analysis would be three t-tests, one for each scale measure.

But class feels like it should be a continuous variable - in which case regressions would be appropriate.

At a higher level of analysis, this sounds like it would benefit from a multivariate analysis, in which the three outcome measures are considered simultaneously (MANOVA if you are working with dichotomous class variable).

$\endgroup$
14
  • $\begingroup$ Thank you for helping me.I am using it as a dichotomous variable, so how would I explain the design if I were to use a MANCOVA, would it be a 2 x 2 MANCOVA? $\endgroup$
    – KEA
    Commented Nov 11, 2015 at 15:12
  • $\begingroup$ Would I be better substituing the racism and sexism scales for just the stereotype one and if so what anaylse should I use $\endgroup$
    – KEA
    Commented Nov 11, 2015 at 15:18
  • $\begingroup$ @KEA what is your research question? It sounded initially like the three scales were all meant to be indices of prejudice - just different forms. So you would have three dependent measures and one factor (class). If so, it wouldn't be a MANCOVA as you have no covariate (that you've listed). And you only have one factor (class) so it would be the multivariate equivalent of a t-test. (So not 2x2, which implies two factors) $\endgroup$
    – J Taylor
    Commented Nov 11, 2015 at 16:23
  • $\begingroup$ @KEA to answer the second part of your question - if you ditched the racism and sexism scales, you'd only have one DV and you'd be doing a simple t-test. $\endgroup$
    – J Taylor
    Commented Nov 11, 2015 at 16:26
  • $\begingroup$ My research question is Is there an interaction between social class and prejudice, $\endgroup$
    – KEA
    Commented Nov 11, 2015 at 16:27

Your Answer

By clicking “Post Your Answer”, you agree to our terms of service and acknowledge you have read our privacy policy.

Not the answer you're looking for? Browse other questions tagged or ask your own question.