What is the difference between spatial dependence and spatial heterogeneity?
My question is motivated by readings in model specification problems in spatial econometrics, in particular Anselin (2010).
What is the difference between spatial dependence and spatial heterogeneity?
My question is motivated by readings in model specification problems in spatial econometrics, in particular Anselin (2010).
These terms probably do not have a universally accepted technical definition, but their meanings are reasonably clear: they refer to second order and first order variation of a spatial process, respectively. Let's take them by order after first introducing some standard concepts.
A spatial process or spatial stochastic process can be thought of as a collection of random variables indexed by points in a space. (The variables have to satisfy some natural technical consistency conditions in order to qualify as a process: see the Kolmogorov Extension Theorem.)
Note that a spatial process is a model. It is valid to use multiple different (conflicting) models to analyze and describe the same data. For instance, models of naturally occurring concentrations of metals in soils may be purely stochastic for small regions (such as a hectare or less) whereas over large regions (extending many kilometers) it's usually important to describe underlying regional trends deterministically--that is, as a form of spatial heterogeneity.
Spatial heterogeneity is a property of a spatial process whose mean (or "intensity") varies from point to point.
The mean is a first order property of a random variable (that is, related to its first moment), whence spatial heterogeneity can be considered a first order property of a process.
Spatial dependence is a property of a spatial stochastic process in which the outcomes at different locations may be dependent.
Often we can measure dependence in terms of the covariance (second moment) or correlation of the random variables: in this sense, dependence can be thought of as a second-order property. (Sticklers will be quick to point out that correlation and independence are not the same, so equating dependence with second order properties, although intuitively helpful, is not generally valid.)
When you see patterns in spatial data, you can usually describe them either as heterogeneity or dependence (or both), depending on the purpose of the analysis, prior information, and the amount of data.
Some simple, well-studied examples illustrate these ideas.

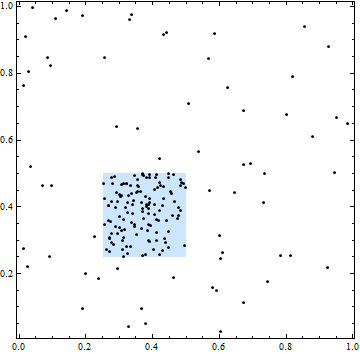
In this figure, the square demarcates an area of higher spatial intensity. All point locations, however, are independent: the clustering and gaps in points are typical of independent randomly chosen locations.

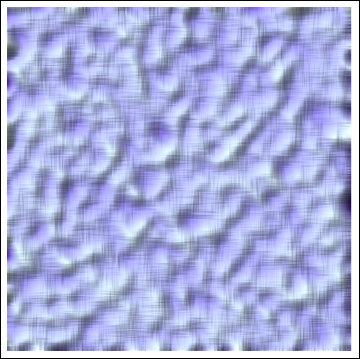
The spatial dependence in this Gaussian process is apparent through the patterns of ridges and valleys. They are homogeneous, though: there is no trend overall. Note, however, that if we were to focus on a small part of this area, we might elect to treat it as an inhomogeneous process (that is, with a trend) instead. This illustrates how scale can influence the model we choose.

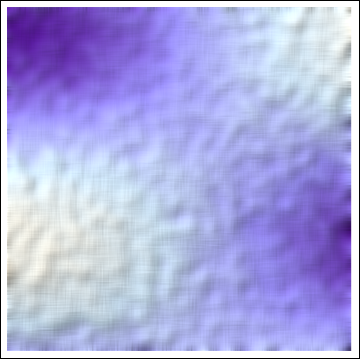
This image shows a different realization of the random component of this process than used for the previous illustration, so the patterns of small undulations will not be exactly the same as before--but they will have the same statistical properties.
The notion of spatial heterogeneity in current spatial statistics is only used to characterize local variance of spatial dependence or regression. I suggested a broad perspective on spatial heterogeneity, which refers to the scaling pattern of far more small things than large ones. Importantly the scaling pattern recurs multiple times, measured by ht-index.
Under the new definition, spatial heterogeneity should be formulated as a scaling law. Thus the heterogeneity is power law like rather than Gaussian distribution like.
With this broad perspective, both spatial dependence and heterogeneity depict the true picture of the Earth's surface. There are far more small things than large ones across all scales or globally, but things are more or less similar at one scale or locally; see this paper for more details.
https://www.researchgate.net/publication/282310447_A_Fractal_Perspective_on_Scale_in_Geography
The question is dependent upon the mathematical definition of the two concepts. There are already several definitions of spatial autocorrelation like Moran's I, but few of spatial heterogeneity, probably because the latter is scale dependent and would be different in distinct scales. I defined the spatial stratified heterogeneity (the full paper is expected online on 12 March 2016 in journal Ecological Indicators):
A measure of spatial stratified heterogeneity
Jin-Feng Wang1*, Tong-Lin Zhang2, Bo-Jie Fu3
ABSTRACT
Spatial stratified heterogeneity, referring to the within-strata variance less than the between strata-variance, is ubiquitous in ecological phenomena, such as ecological zones and many ecological variables. Spatial stratified heterogeneity reflects the essence of nature, implies potential distinct mechanisms by strata, suggests possible determinants of the observed process, allows the representativeness of observations of the earth, and enforces the applicability of statistical inferences. In this paper, we propose a q-statistic method to measure the degree of spatial stratified heterogeneity and to test its significance. The q value is within [0, 1] (0 if a spatial stratification of heterogeneity is not significant, and 1 if there is a perfect spatial stratification of heterogeneity). The exact probability density function is derived. The q-statistic is illustrated by two examples, wherein we assess the spatial stratified heterogeneities of a hand map and the distribution of the annual NDVI in China. --Jinfeng Wang 2016-3-8