9
$\begingroup$

After standardising the explanatory variables the difference in magnitude between the explanatory variables and the target data is ~3 orders of magnitudes. I want to know if transformation of the target data will still give valid results.

Thanks a lot folks!

$\endgroup$
3
  • 1
    $\begingroup$ Is there a reason why you want/need to standardize the dependent variable? Then your dependent variable, rather than being in a natural scale like "meters," is in a scale with units of the standard deviation found in your particular sample. Similarly for the explanatory variables. Staying in the original scales can help with interpretation and with the ability of others to reproduce your results. $\endgroup$
    – EdM
    Commented Jan 5, 2016 at 22:27
  • 1
    $\begingroup$ The coefficients in a regression model take care of differences in scale. (There are sometimes reasons to standardize but from your description you don't seem to be in need of it.) $\endgroup$
    – Glen_b
    Commented Jan 6, 2016 at 0:27
  • $\begingroup$ It only makes sense to normalize your data if it is normally distributed in the first place. If the distribution of your explanatory variables cannot be made to be normal, then modelling them as such will be incorrect and you will likely wind up with z-scores that are very large in magnitude and have poor explanatory power. $\endgroup$
    – Carl
    Commented May 18, 2021 at 15:10

2 Answers 2

10
$\begingroup$

Scaling or zeroing will will not change the regression or classification results. The only down side is lose of interpretability.

Here are working examples in R showing that any combination of scaling or zeroing produces the same regression line.

Coefficients can be different, and that is okay. Here are the coefficients calculated in the models below in order.

  (Intercept)         disp
1    29.59985  -0.04121512
2    20.09062  -0.04121512
3    26.66946 -16.52314159
4    26.66946 -16.52314159

No zeroing or scaling

# orginal data
df <- mtcars
png("mtcars_original.png")
plot(df$disp, df$mpg, main="MPG VS Displacment")
abline(lm(mpg ~ disp, df), col = 2)
dev.off()
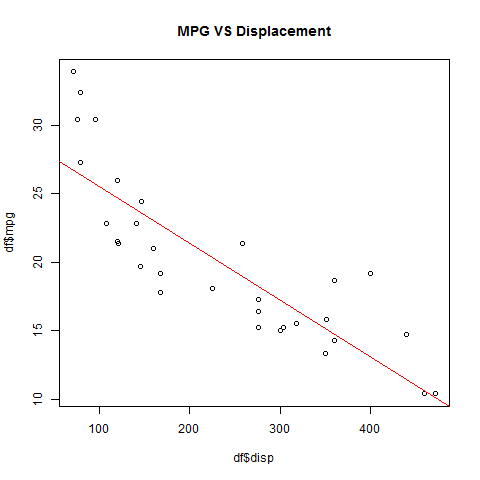
MPG VS Displacement

Zeroed

# zeroed displacement
df <- mtcars
df$disp <- df$disp - mean(df$disp)
png("mtcars_zeroed.png")
plot(df$disp, df$mpg, main="MPG VS Zeroed  Displacement")
abline(lm(mpg ~ disp, df), col = 2)
dev.off()
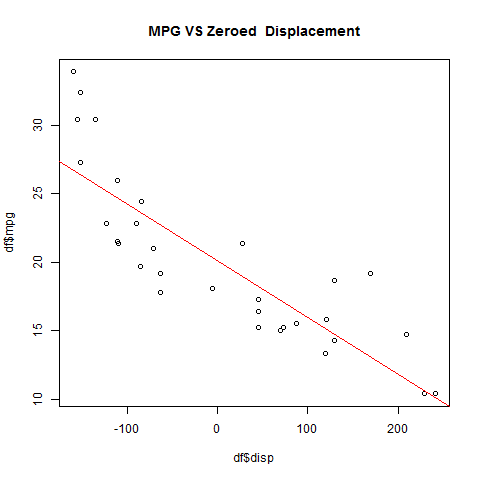
MPG VS Zeroed Displacement

Scaled

# scaled displacment
df <- mtcars
df$disp <- (df$disp - min(df$disp)) / ( max(df$disp) -  min(df$disp))
png("mtcars_scaled.png")
plot(df$disp, df$mpg, main="MPG VS Scaled Displacment")
abline(lm(mpg ~ disp, df), col = 2)
dev.off()
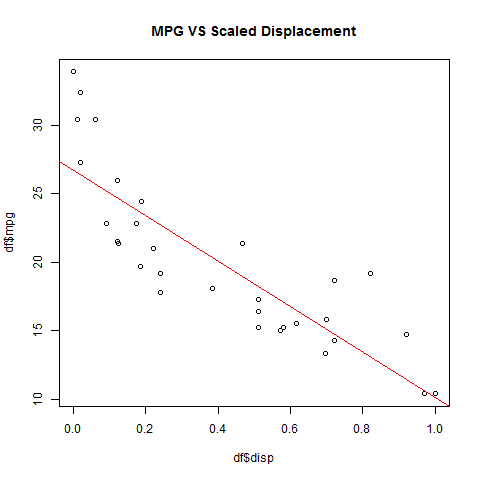
MPG VS Scaled Displacement

Zeroed & Scaled

# zeroed & scaled displacment
df <- mtcars
dt$disp <- df$disp - mean(df$disp)
df$disp <- (df$disp - min(df$disp)) / ( max(df$disp) -  min(df$disp))
png("mtcars_zeroed_scaled.png")
plot(df$disp, df$mpg, main="MPG VS Scaled & Zeroed Displacment")
abline(lm(mpg ~ disp, df), col = 2)
dev.off()
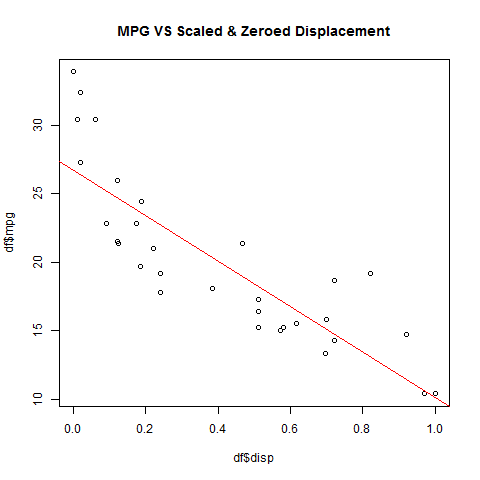
MPG VS Scaled & Zeroed Displacement

$\endgroup$
1
$\begingroup$

It will. Your measurements are coordinates. For every value on the explanatory variable, you have a coordinate measurement on the target variable. If you don't change the order of either, then the relation remains intact. Right?

$\endgroup$

Your Answer

By clicking “Post Your Answer”, you agree to our terms of service and acknowledge you have read our privacy policy.

Not the answer you're looking for? Browse other questions tagged or ask your own question.