6
$\begingroup$

When choosing each split, recursively, in a regression tree, I understand that you want to measure the spread, in each side of the split, essentially.

So, in some sources, including this one at 6 minutes into the video, I see that a different form of variance is used, except the sum of squared residuals of each region is not divided by the number of points.

form of variance not divided by the number of points

Is this a typical metric to use for determining where to split? A similar question here also shows the same equation.

I'm wondering why we don't divide each term by the number of points in each region, i.e. left and right of the split?

That way, the splits would get more credit for reducing the variance of MANY points in a single region, rather than weighting the error of each region the same, regardless of the number of points?

EDIT: I suppose a broader and more important question is why is the number of points in each region not considered when computing error in each left and right region of the split? I haven't found an error metric that takes the number of points into account.

$\endgroup$
7
  • 1
    $\begingroup$ No, because you'd be dividing by the number of points in a region. In other words, you would be, in effect, disregarding the number of points in the region. Make sense? $\endgroup$
    – Steve S
    Commented Jan 10, 2016 at 2:41
  • $\begingroup$ No, can you elaborate on "disregarding", please? $\endgroup$
    – makansij
    Commented Jan 10, 2016 at 2:56
  • $\begingroup$ Gini score is often used for a split metric. link $\endgroup$ Commented Jan 10, 2016 at 11:49
  • $\begingroup$ This "disregarding the number of points" is exactly what the example in my answer should demonstrate: using the variance, the preferred split leaves one data point on the right. SS instead regards the larger numbers and splits in the middle point. $\endgroup$
    – davidhigh
    Commented Jan 11, 2016 at 1:32
  • $\begingroup$ @EngrStudent, Can gini be computed for a regression like this, though? $\endgroup$
    – makansij
    Commented Jan 11, 2016 at 2:16

4 Answers 4

4
$\begingroup$

First off, let me just say that there are plenty of metrics that could be used to determine a split in the Regression Tree (that's an altogether different question) but the criterion you mentioned--minimizing the sum of squares--is definitely the most popular.

With respect to your second question (i.e. why we don't divide by the number of points in a region), here is an example that might give insight into the potential problems related to splitting based on the minimum sum of variances:

library(MASS)
data(Boston)

tss <- function(x){
    if (length(x) == 0){
        return(0)
    }
    sum((x-mean(x))^2)
}

ss <- tss(Boston$medv)
new.ss <- ss
which.s <- NA

for (i in Boston$lstat){
        mask <- Boston$lstat <= i
        new.y1 <- Boston$medv[mask]
        new.y2 <- Boston$medv[!mask]
    temp.ss <- tss(new.y1) + tss(new.y2)
    if (temp.ss < new.ss){
        new.ss <- temp.ss
        which.s <- i
    }
}


plot(medv ~ lstat, data=Boston, col=ifelse(Boston$lstat < which.s, 'red', 'darkblue'))

Now, try switching sum to mean in the tss function and re-run this entire block of code. Notice how different the resulting plot is?

$\endgroup$
1
  • 3
    $\begingroup$ This is a nice piece of code, thanks. I was hoping for something to help me understand the theory and gain some intuition behind this. Would you mind posting the plot here since I am primarily a python user? Is there any reason why the plot turns out that way? $\endgroup$
    – makansij
    Commented Jan 10, 2016 at 4:34
3
$\begingroup$

So the best split offers the best gain. If the loss function is sum of squares the gain function could look like:

$\sigma^2 = \frac{\sum{(y_i-\overline{y})^2}}{N} = SS/N$, (SS is sum of sqaures)

$gain = \frac{SS_{parent}}{n_{parent}} - w_l \frac{SS_{left}}{n_{left}} - w_r \frac{SS_{right}}{n_{right}}$

$w_l=n_{left} , w_r=n_{right}$ , weight daughter nodes by size

$ \frac{SS_{parent}}{n_{parent}} = k$, always the same for any split of parent

$argmin: SS_{left} + SS_{right} $, for any split by parent node

This simplified cost function will yield the same ranking of splits and is much faster to compute. It is possible to perform rolling SS computation such that, SS does not have to be fully recalculated each split. Instead the $SS_{left}$ and $SS_{right}$ are iteratively adjusted for moving one sample at the time from left node to right node. Here's an answer for RF classification where the same trick is used.

$\endgroup$
2
  • 1
    $\begingroup$ It is a little difficult for me to follow your answer. Is your justification for the simplified cost function a result of it being simpler and easier to compute? And, when is best gain not inversely related to lowest ` loss`? $\endgroup$
    – makansij
    Commented Jan 10, 2016 at 20:11
  • $\begingroup$ Nodes are weighted by size number. Variance is SS /N. Thus N cancels out. But size still matters :) Many membered nodes have more squares to sum. $\endgroup$ Commented Jan 10, 2016 at 21:39
3
$\begingroup$

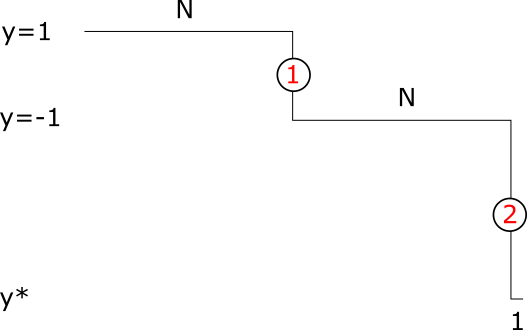
In order to compare the behavior of the different splitting formulas, let's consider a simple example:

We have $N$ predictors with value $y=1$ in the left, $N$ predictors with value $y=-1$ in the right, and a single point at the right boundary with value $y^\ast$.
enter image description here

There are two reasonable split points in this scenario, first the point (1) in the middle, and the point (2) at the right boundary.

When $N$ is large, say $N=100$, I would prefer the split to be made at the point marked by the red (1). Only if the value of $y^\ast$ becomes very low, I would find a split at (2) reasonable.

So, let's calculate how the split position changes in dependence of the value of $y^\ast$: For which $y^\ast$ is the split made at (1), or how low $y^\ast$ might get until the split occurs at (2).

For the calculations we first use the criterium the OP posted in the question, which involves the sum of squares (SS):


Split at (1):

  • Mean left: $1$, SS Left: $0$

  • Mean right: $\mu_r = (y^\ast - N)/(N+1)$, SS right: $N(-1 - \mu_r)^2 + (y^\ast - \mu_r)^2$


Split at (2):

  • Mean left: $0$, SS Left: $2N$

  • Mean right: $y^\ast$, SS right: $0$


Thus, we get a split at point (1) if

$$N(-1 - \mu_r)^2 + (y^\ast - \mu_r)^2 \leq 2N$$

Inserting $\mu_r$ and setting equal the two sum of squares (SS), Wolfram Alpha gives as solution

$$y_{SS}^\ast = -1 - \sqrt{2N} \ \underbrace{\sqrt{\frac{(N+1)^2}{(N^2+1)}}}_{\approx 1} \ \approx \ -1 - \sqrt{2N}$$

That means, for a value $y$ above $y_{SS}^\ast$, the split is made at (1), below $y_{SS}^\ast$ the split is made at (2). One sees that for large $N$ the split is preferred in the middle.

Now, doing the same for the version of the splitting formula which includes the variance, the result is

$$y_{VAR}^\ast = -1 - \sqrt{\frac{(N+1)^2}{(N^2+1)}} \ \approx \ 1$$

That is, the factor $\sqrt{2N}$ is missing. With this, the split is made at (2) if the value at the boundary is slightly lower than $-1$, regardless of the number of datapoints $N$.


Conclusion: The splitting formula using the sum of squares (SS) leads to the more intuitive behaviour that the split is preferred at point (1) in the middle.

Instead, the formula with the variance does not consider the number of particles in the respective regions, as the SS value is divided by the number of data points. As seen above, it easily prefers a split where only one data point is separated to a balanced split where the region is halfed.

Summarizing, I would prefer the splitting criterium containing the sum-of-squares to the splitting criterium containing the variance.

$\endgroup$
5
  • $\begingroup$ When you say "The split is made at (2) if the value at the boundary is slightly lower than −1", do you mean "-2"? Since the part in the square root collapses to "1", and thus y* = -1-1=-2? $\endgroup$
    – makansij
    Commented Jan 11, 2016 at 0:42
  • 1
    $\begingroup$ @Sother: With (1) and (2) I mean the positions marked red in the picture. $\endgroup$
    – davidhigh
    Commented Jan 11, 2016 at 1:10
  • $\begingroup$ Also, in the section split at (1) the "Variance of the right" should be divided by a factor of N+1 I believe. It looks you have the sum of squares (SS) rather than the Variance. $\endgroup$
    – makansij
    Commented Jan 11, 2016 at 1:11
  • 1
    $\begingroup$ @Sother: correct, it's not the var although I wrote that... It's the quantities of the criterium in your post -- which is the SS as you say $\endgroup$
    – davidhigh
    Commented Jan 11, 2016 at 1:18
  • $\begingroup$ edited the answer and added a better explanation. Hope it becomes clear now, as the example is quite good to gain some intuition. $\endgroup$
    – davidhigh
    Commented Jan 11, 2016 at 8:54
0
$\begingroup$

It's an old question but the reason I can think of is as follows: We don't divide each term by the number of points in each region because while performing the split, we are not interested in average deviance instead we are interested in the absolute deviance; thus, a larger set of observations will usually have a larger deviance than a smaller set in the same situation.

$\endgroup$

Your Answer

By clicking “Post Your Answer”, you agree to our terms of service and acknowledge you have read our privacy policy.

Not the answer you're looking for? Browse other questions tagged or ask your own question.