I have run a 1 way ANOVA and carried out some post hocs to see which direction the results go in. If I report the direction of the findings - e.g. this group was higher than the other, which statistic do I quote? I have carried out Games-Howell post hoc and all it seems to come with is an associated p value, is this all that I report?
3 Answers
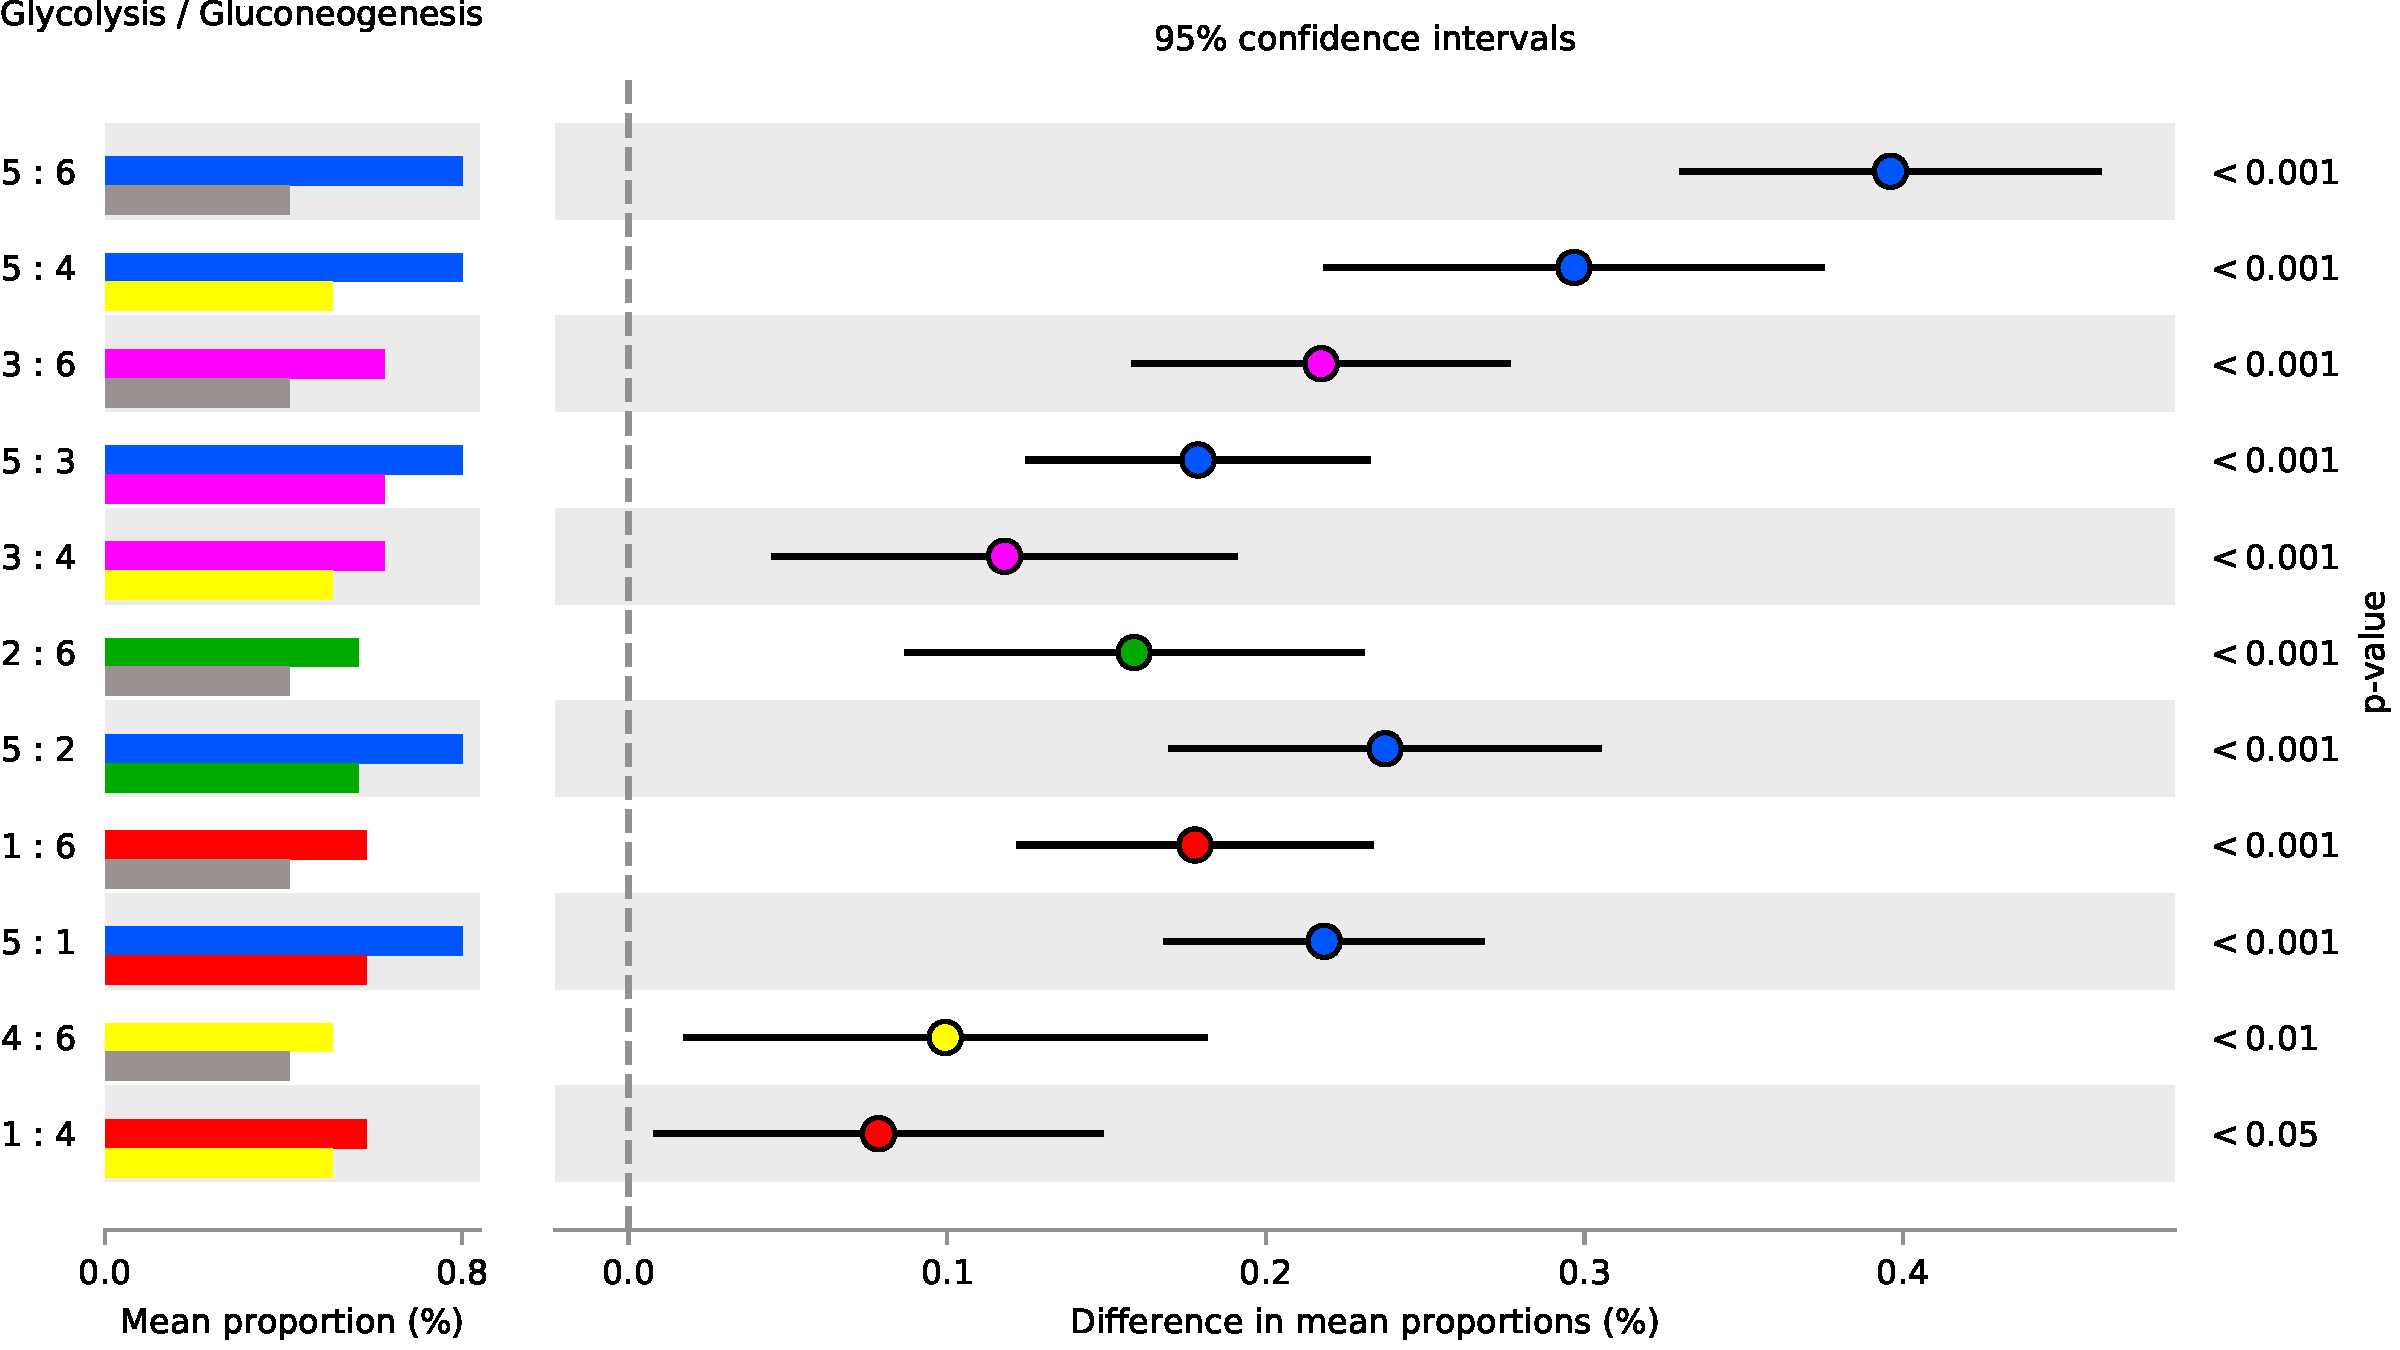
After reporting the significance and type of your ANOVA test, you can create a figure showing the difference between the means and the confidence intervals for each pair of groups with significant differences, providing the p-value for each pairwise comparison. In addition it is adviced to correct for multiple testing if the number of groups is large, and to filter those results with low size effects.
Below there is a possible representation in which the difference in mean proportions of genes belonging to Glycolysis pathways is tested across 6 different groups. Each row represents a pairwise comparison and in columns there are, from left to right, the comparison performed (e.g. group 5 vs group 6), the mean proportion for each group (bar plot), the difference in mean proportions (confidence interval), and the p-value (uncorrected for multiple testing, it would be adviced to add "corrected" in the label otherwise).
EDIT
In this post it is shown how to use the library multicompView to perform a Tukey Test and to generate a representation similar to the one I shown above (which was created with STAMP and hence it limited to a particular type of data). For completeness, I paste the example of the code proposed in that post:
# library
library(multcompView)

# Create data
set.seed(1)
treatment <- rep(c("A", "B", "C", "D", "E"), each=20)
value=c( sample(2:5, 20 , replace=T) , sample(6:10, 20 , replace=T), sample(1:7, 20 , replace=T), sample(3:10, 20 , replace=T) , sample(10:20, 20 , replace=T) )
data=data.frame(treatment,value)

# What is the effect of the treatment on the value ?
model=lm( data$value ~ data$treatment )
ANOVA=aov(model)

# Tukey test to study each pair of treatment :
TUKEY <- TukeyHSD(x=ANOVA, 'data$treatment', conf.level=0.95)

# Tuckey test representation :
plot(TUKEY , las=1 , col="brown")
```
You can report the $p$-values, or can make a figure with the means (plus/minus the standard error) and indicate with different letters those means that are statistically different according to G&H test. Games and Howell procedure uses the Studentized maximum modulus distribution. Hope it help! and excuse my english
The approach is just one of many possible ways to adjust for multiplicity. You could also apply bootstrap p-value adjustment ala Westfall and Young.

