Are there basic minimum requirements for funnel plots to be valid or having a sufficient quality to assess publication bias?
For example in regard to:
- Numbers of included studies?
- Size of included studies?
- ...
This question could be interpreted in one of two ways. You could be asking whether there are requirements for subjective evaluations of funnel plots to be considered valid (i.e., looking at a funnel plot and coming to your own conclusion about the presence/absence of small-study effects). Or, alternatively, you could be asking whether there are requirements for empirical evaluations of funnel plots to be considered valid (i.e., using some sort of statistical test for the presence of small-study effects/publication bias).
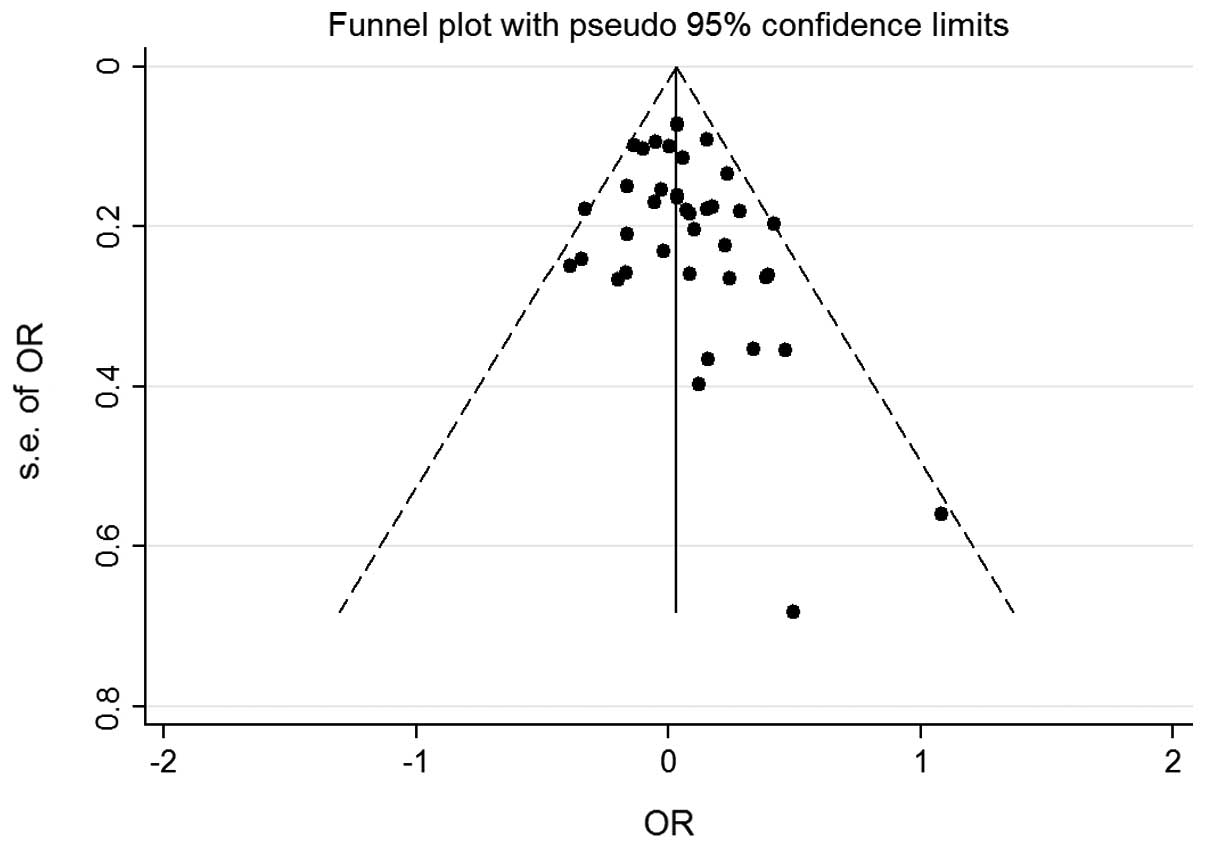
mdewey's answer is clearly based on the first interpretation--they offer a heuristic of no less than 10 studies for subjective interpretations of the funnel plot to be valid. I have two problems with this interpretation (to be clear: not mdewey's answer, given the interpretation, but rather, the interpretation itself). First, subjective interpretations of funnel plots can become increasingly difficult to make as the number of studies in the plot increase. For example, with the funnel plot below (~30 effect sizes?) it is pretty easy to visibly detect a superficial amount of asymmetry in the funnel plot.

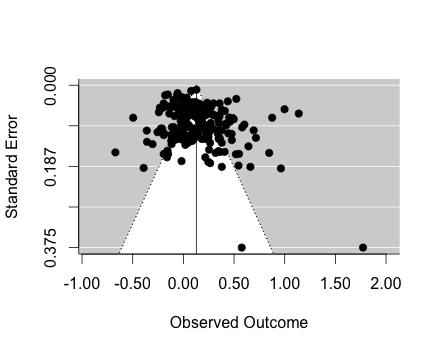
But contrast that plot against one from a much larger meta-analysis (one of my own, below), and you can see that it can become quite unclear how one should interpret a funnel plot when there are many (in this case, 245) effect sizes.

My second objection to interpreting your question as pertaining to subjective assessment of funnel plots is that I simply struggle to understand how one would define "validity" when the method of inspection is subjective- how can one verify/falsify that their interpretation of the funnel plot is legitimate when there are no empirical criteria being used?
So, I interpret your question as being about empirical evaluations of the funnel plot, and indeed, there are a number of statistical tests you can use to determine whether the funnel plot is significantly asymmetrical. And yes, as you intuit, a number of factors (including the number of effect sizes, the precision of the effect sizes, the variability of effect sizes, whether the effect sizes are heterogeneous, etc.,) impact the validity of these tests. I've included a number of references, below, to simulations of different methods of testing funnel plot asymmetry; most compare methods in terms of their power to detect asymmetry, and their false-positive error rates.
None of these simulations appear to espouse number-of-study guidelines for testing funnel plot asymmetry. A simulation by Sterne, Gavaghan, and Egger (2000), however, does give calculated power levels for a regression method and a correlation method, with varied numbers of studies. The Coles/Kliff notes summary of this simulation is that the authors find that only when there is severe bias(read: easily detected small-study effects), and the number of studies is ~20, does the regression test become adequately powered (power ~.80) to detect funnel plot asymmetry. Thus, you probably need at least 20 studies to detect funnel plot asymmetry, and likely will need more unless your data conform to the most optimal conditions for detecting small-study effects. With 10 studies, alternatively, you're only looking at power of ~.30~.50, depending on which test you use (and again, assuming severe bias).
Have a look at the papers too, to see conditions under which false-positives become higher-than-desirable--some methods are better than others for maintaining your false-positive error rate. I'm not sure about other software, but I know the metafor package for R offers users the ability to employ a number of these different methods, depending on their preference (see documentation for the regtest command).
References
Harbord, R. M., Egger, M., & Sterne, J. A. C. (2006). A modified test for small-study effects in meta-analyses of controlled trials with binary endpoints. Statistics in Medicine, 25, 3443-3457.
Moreno, S. G., Sutton, A. J., Ades, A. E., Stanley, T. D., Abrams, K. R., Peters, J. L., & Cooper, N. J. (2009). Assessment of regression-based methods to adjust for publication bias through a comprehensive simulation study. BioMed Central Medical Research Methodology, 9, 1-17.
Peters, J. L., Sutton, A. J., Jones, D. R., Abrams, K. R., & Rushton, L. (2006). Comparison of two methods to detect publication bias in meta-analysis. Journal of the American Medical Association, 295, 676-680.
Sterne, J. A. C., Gavaghan, D., & Egger, M. (2000). Publication and related bias in meta-analysis: Power of statistical tests and prevalence in the literature. Journal of Clinical Epidemiology, 53, 1119-1129.
The conventional answer is about 10 studies. The long answer is that you can do anything you want as long as you are careful in what conclusions you draw from it especially if there is much heterogeneity. Perhaps also worth pointing out that strictly speaking what the plot might show is small study bias, publication bias implies you know the aetiology as there are other ways in which small studies may differ.