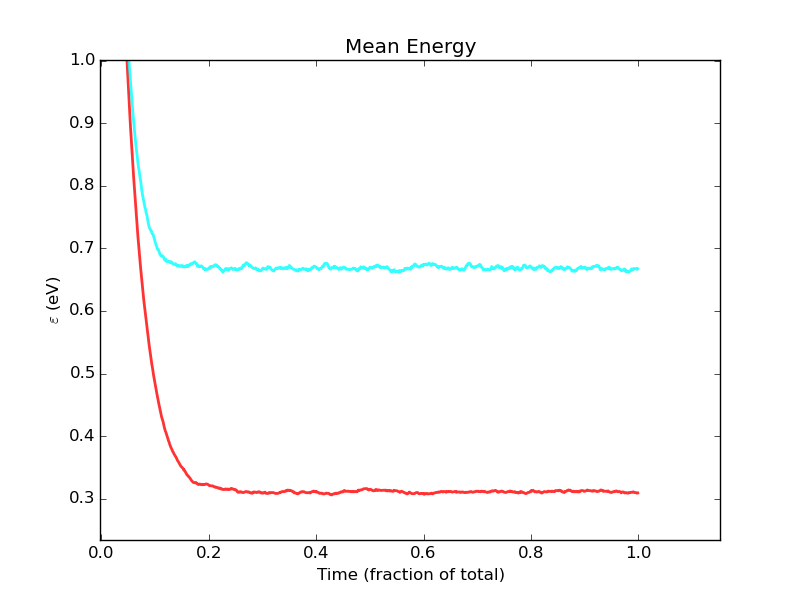
I have a time-series of data that looks like this (as a couple of examples):

This mean energy is the mean over a number of Monte Carlo test particles. The number of particles vs. time is not necessarily constant.
It's clear that both series appear to converge on particular equilibrium values, and by eye-balling it, I'd say that it happens at around t = 0.3 for the cyan line and t = 0.4 for the red line (to be conservative).
My rough definition of reaching equilibrium is that once reached, all subsequent samples lie close to the equilibrium. Defining 'close' is tricky, though.
How can I determine the equilibrium time statistically? There are several problems that I've encountered in my naive home-grown attempts:
- The initial energy may be lower or higher than the equilibrium, and may not move monotonically - there can be a great deal of variation before it settles into equilibrium.
- The variance at later times may abruptly get much larger, as the number of samples used to calculate the mean drops off. I do track the number of samples though, so I can use that information too.
- The variance in the equilibrium may be so large that I can't tell whether the equilibrium is reached by eye-balling it. I'd like the test or algorithm to fail gracefully in such a case, and tell me that there is no clear solution.
