How can I spot if, say, a simple, linear regression will adequately describe some causal relationship purely from the model's output (say, from the command summary(lm( y ~x )) in R), as opposed to from looking at QQ plots or residual plots? Is it possible? Perhaps something to do with the estimated variance?
$\begingroup$
$\endgroup$
3
-
1$\begingroup$ There is the usual $R^2$ value which indicates how good the linear fit is. This will be a function of the estimated variance, so that might give a good idea. $\endgroup$– GreenparkerCommented Mar 7, 2016 at 12:16
-
5$\begingroup$ Nothing in the usual output tells you anything about causal relationships. Causality is all in the design and substantive context and interpretation. $\endgroup$– Nick CoxCommented Mar 7, 2016 at 12:23
-
2$\begingroup$ You cannot tell from that output whether the model is suitable or not. See the four data sets in the Anscombe quartet which have identical output. $\endgroup$– Glen_bCommented Mar 7, 2016 at 14:03
Add a comment
|
1 Answer
$\begingroup$
$\endgroup$
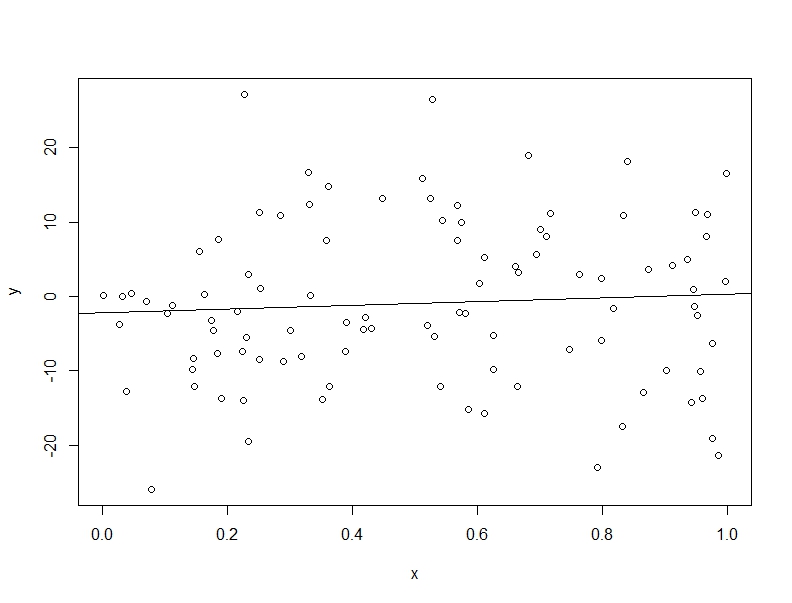
As Nick Cox already commented, you can't. Here is a little example where I generate data according to a "causal" relationship between $y$ and $x$, and yet, because that relationship is noisy, the output neither gives you a statistically significant relationship nor an $R^2$ that differs perceptibly from zero.
n <- 100

beta <- 0.1
x <- runif(n)
u <- rnorm(n,sd=10)
y <- x*beta + u
> summary(lm(y~x))

Call:
lm(formula = y ~ x)

Residuals:
     Min       1Q   Median       3Q      Max
-23.9617  -6.8501  -0.9274   8.0018  28.7454

Coefficients:
            Estimate Std. Error t value Pr(>|t|)
(Intercept)   -2.134      2.155   -0.99    0.324
x              2.383      3.608    0.66    0.511

Residual standard error: 10.83 on 98 degrees of freedom
Multiple R-squared:  0.004431,  Adjusted R-squared:  -0.005728
F-statistic: 0.4361 on 1 and 98 DF,  p-value: 0.5105

