9
$\begingroup$

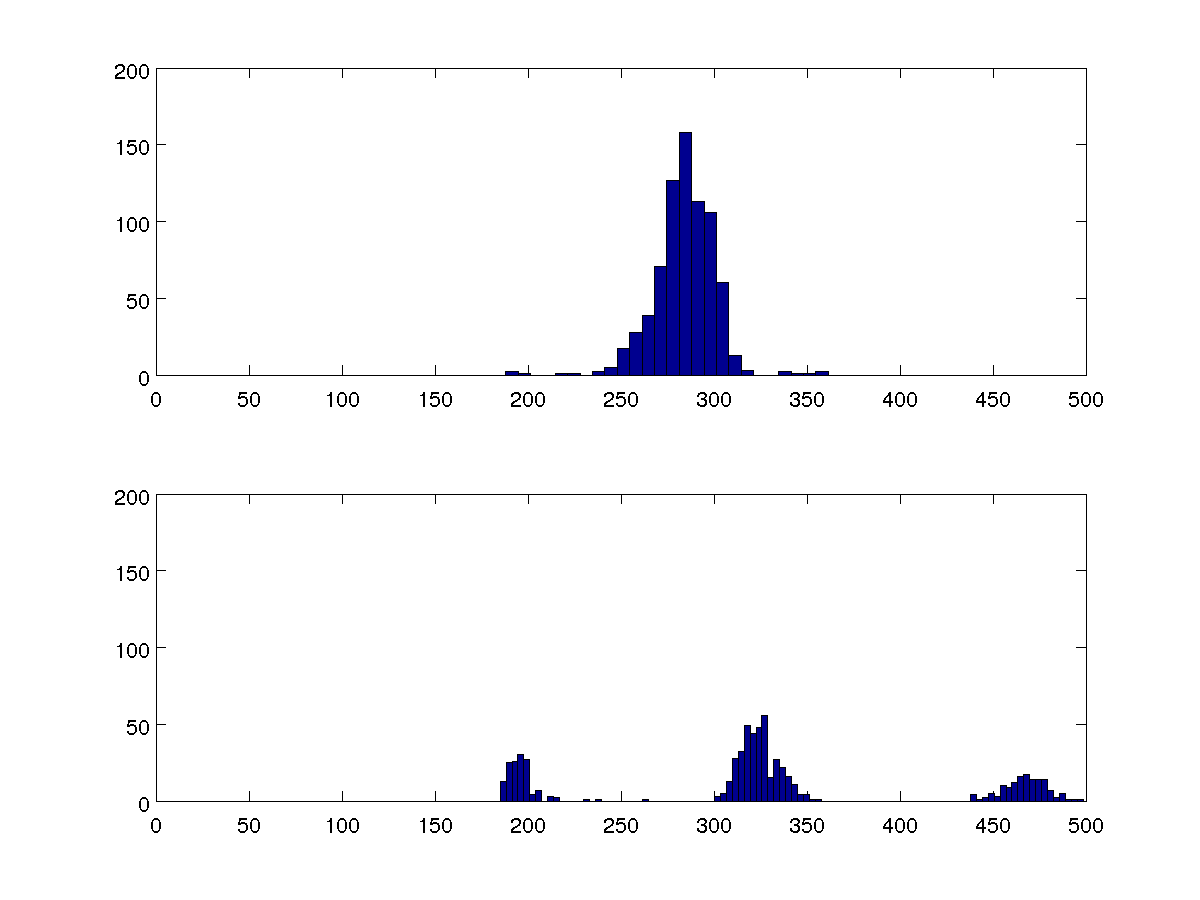
I've got some data on the time between heart beats of a human. One indication of ectopic (extra) beats is that these intervals are clustered around three values instead of one. How can I obtain a quantitative measure of this?

I'm looking to compare multiple data sets, and these two 100-bin histograms are representative of all of them.
enter image description here

I could compare the variances, but I want my algorithm to be able to detect whether there is one or three clusters in each case without comparing to the other cases.

This is for offline processing, so there's a lot of computation power available, if that's needed.

$\endgroup$
1

4 Answers 4

3
$\begingroup$

I advise strongly against using k-means here. The results for different values of k aren't very well comparable. The method is just a crude heuristic. If you really want to use clustering, use EM clustering, since your data seems to contain normal distributions. And validate your results!

Instead, the obvious approach is to try fitting a single Gaussian function and (for example using the Levenberg-Marquard method) fit three Gaussian functions, maybe constrained to the same height (to avoid degeneration).

Then test, which of the two distributions fits better.

$\endgroup$
3
  • $\begingroup$ Thanks, I didn't know of Levenberg-Marquardt! These clusters are not Gaussian; do you still think Gaussian functions would be the best PDF to fit them to? $\endgroup$
    – Nikolaus
    Commented Jan 2, 2012 at 11:57
  • $\begingroup$ +1 to this and to Greg Snow. I totally agree with this advice. @Nikolaus I think this looks "gaussian enough" to fit a mixture of gaussians distributions. You don’t want a perfect fit, just a way to check how many clusters there are. In this optic, constraining all components to share the same standard deviation can be a good idea (for the reasons explained by Anony-Mousse). $\endgroup$
    – Elvis
    Commented Jan 2, 2012 at 12:37
  • $\begingroup$ They clearly look Gaussian enough to me. K-means models data with Voronoi cells. It does not seem sensible to me to assume that the best split point is exactly in the middle of the two neighboring means. $\endgroup$ Commented Jan 2, 2012 at 18:09
6
$\begingroup$

Fit a mixture distribution to the data, something like a mixture of 3 normal distributions, then compare the likelihood of that fit to a fit of a single normal distribution (using likelihood ratio test, or AIC/BIC). The flexmix package for R may be of help.

$\endgroup$
5
$\begingroup$

If you want to use K-means clustering, then you need a way to compare the $K=1$ and $K=3$ cases. One approach would be to use the gap statistic from Tibshirani et al. and choose the $K$ that provides the better value. There's an R implementation available in SLmisc, though that particular function will try $K=1,2,3$, so you will need to take care to ensure that only $K=1$ or $K=3$ can be returned as the optimal value.

$\endgroup$
3
$\begingroup$

Use a K-means clustering algorithm to identify the various means

Look for function KNN in R-seek to find the appropriate function

$\endgroup$
5
  • 1
    $\begingroup$ ahh, I was just about to post that! You can also refer to this link for the codes and whatnots: statmethods.net/advstats/cluster.html $\endgroup$
    – King
    Commented Dec 21, 2011 at 16:15
  • $\begingroup$ I tried with Matlab's kmeans function. The resulting means vary widely from try to try. (Bad heuristics in this implementation?) For the 1-cluster set, I get means around (270,293,693) sometimes, around (260,285,308) sometimes. For the 3-cluster set, some answers are (196,324,468,) and (290,459,478). $\endgroup$
    – Nikolaus
    Commented Dec 21, 2011 at 16:46
  • $\begingroup$ Is there a place where I can paste the data? $\endgroup$
    – Nikolaus
    Commented Dec 21, 2011 at 16:47
  • $\begingroup$ Oh, about that 693 mean: there are two obvious outliers, a 532 and an 855, out of a total 755 values. All the rest of the values can be seen in the histogram. $\endgroup$
    – Nikolaus
    Commented Dec 21, 2011 at 16:50
  • 1
    $\begingroup$ You must look beyond the means you get from k-means, and see how well they actually describe your data! $\endgroup$ Commented Jan 2, 2012 at 10:55

Your Answer

By clicking “Post Your Answer”, you agree to our terms of service and acknowledge you have read our privacy policy.

Not the answer you're looking for? Browse other questions tagged or ask your own question.