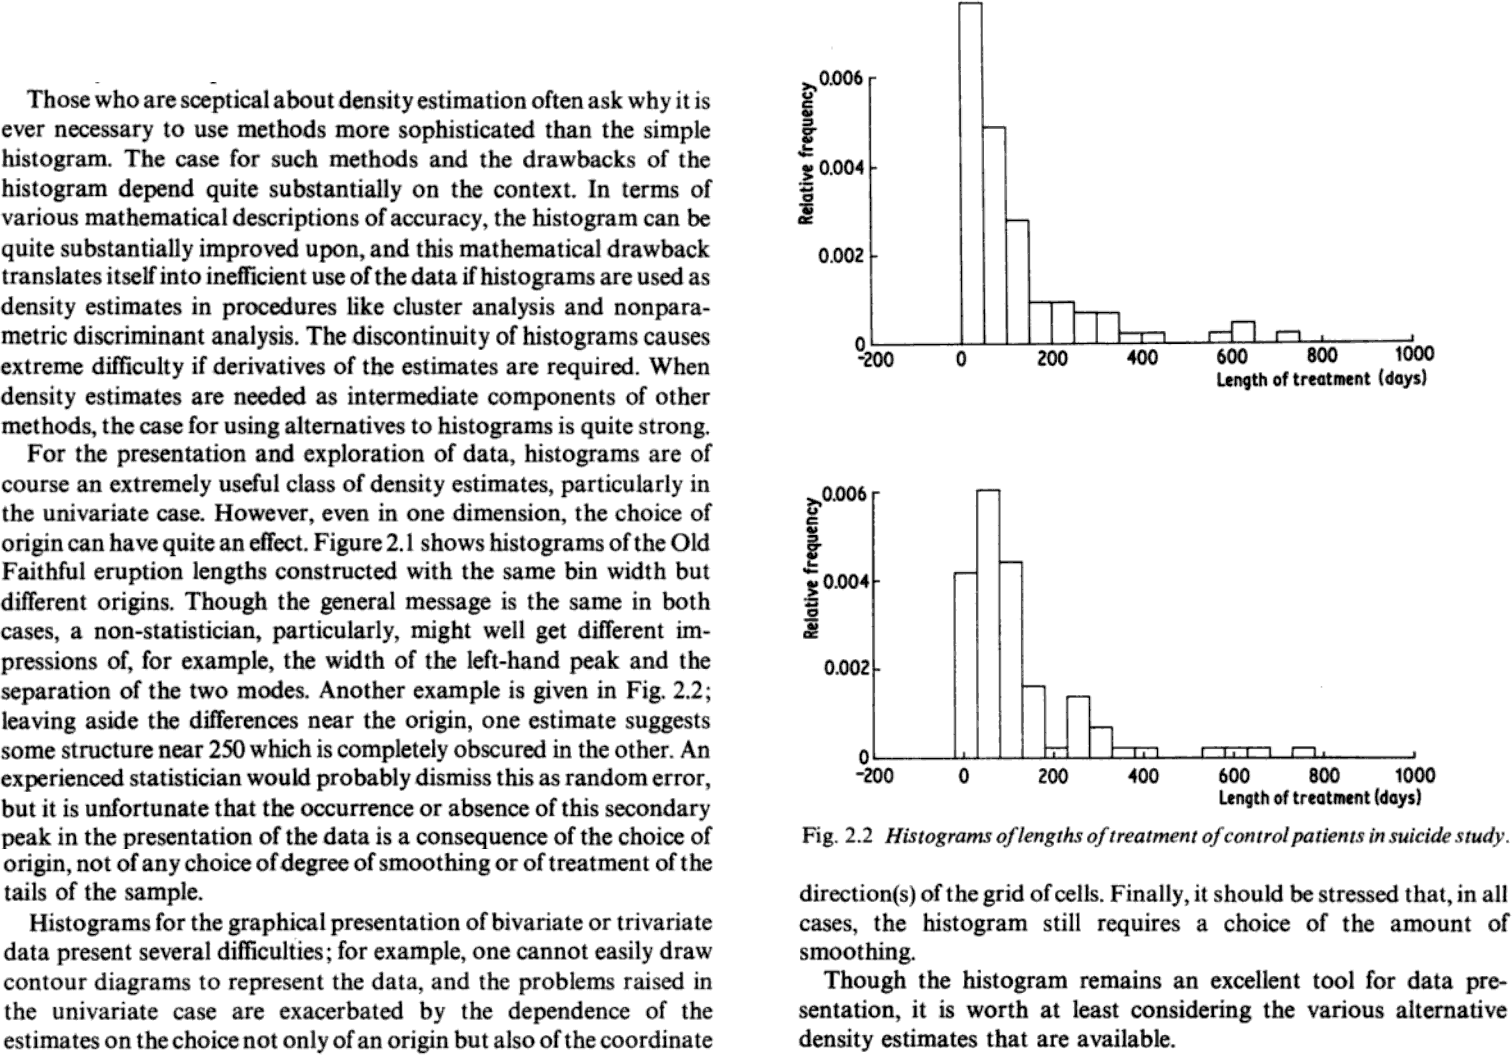
I decided to go looking for a particular paper that I saw briefly, probably at least a decade ago, since it would be relevant (to my recollection it discusses issues with the impact of bin width on the impression of shape with a striking example that looks sort of exponential at one bin width and not exponential with another) but I couldn't find it. In searching for it, I did come across a few things though, including:
Jeffrey S. Simonoff (1996) Smoothing Methods in Statistics
Sec 2.4 (in particular p28 and 29 including figure 2.8 discusses the
effect of changing bin anchor
Also see
Simonoff, J. S. and Udina, F. (1997),
"Measuring the stability of histogram appearance when the anchor position is changed",
Computational Statistics and Data Analysis, 23, (1997), pp. 335-353,
http://hdl.handle.net/10230/655
Besides discussing bin anchor (bin origin), it also looks to have at least some discussion of bin width; fairly technical. Figure 1 in that papershows the impact of changing bin origin on a data example
The 2004 book by Härdle, Müller, Sperlich, and Werwatz,
Nonparametric and Semiparametric Models discusses the effect of bin origin - Figure 2.3 shows an example of the effect of changing binwidth and section 2.3 discusses the effect of changing bin origin.
Härdle, W., Müller, M., Sperlich, S., & Werwatz, A. (2004).
Nonparametric and Semiparametric Models.
New York: Springer Series in Statistics, Springer
and closely related to that,
Marlene Müller (2010),
"Exploring data with non- and semiparametric models."
ICOTS8 Invited paper,
http://iase-web.org/documents/papers/icots8/ICOTS8_4B3_MULLER.pdf
also has a similar brief discussion and figure 1 shows the effect in an example
Keith N. Sircombe (2004),
"AgeDisplay: an EXCEL workbook to evaluate and display univariate geochronological data using binned frequency histograms and probability density distributions",
Computers & Geosciences 30, 21–31
shows an effect on the appearance of histograms of changing bin width:
The subtle variation in appearance and interpretation for a variety of bin widths is illustrated in Fig. 3. Although all the histograms show the age distribution is generally dispersive with two prominent modes (~2950 and ~3150 Ma), the relative prominence of the two modes change; this could alter interpretations about the relative importance of these modes.
David C. LeBlanc (2004), Statistics: Concepts and Applications for Science, Vol. 2
Figure 2.3 (Sec 2.2, p39) shows the effect on appearance of changing bin width on a histogram

