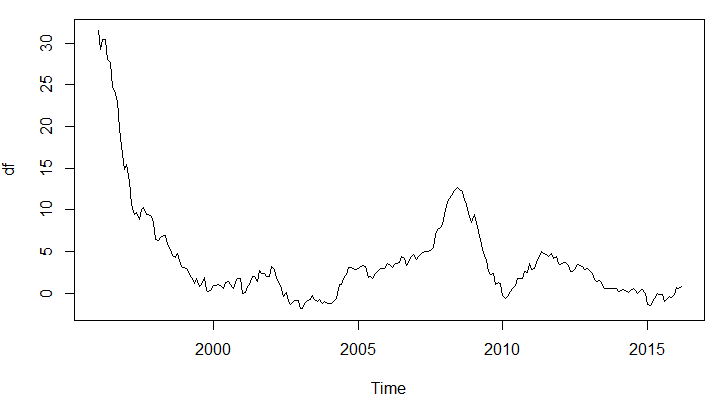
I can't seem to make sense of the following results. The time-series looks more non-stationary than stationary, and when I fit an ARMA(1, 0, 0) it estimates the AR(1) term to be very close to unity (0.99). From this I would expect a simple Dickey-Fuller test with no augmented autoregressive components to either fail or just marginally succeed to reject the null of a unit root. However, the test rejects the null with a p-value of less than 0.01.
I've read all the other questions on the ADF test, but still fail to understand the intuition behind these results.
(when the ADF test is run without specifying the k-order it picks an order of 6, if that helps).
df <- structure(c(31.5, 29.2, 30.5, 30.5, 28.1, 27.7, 24.7, 24.3, 23,
            19.8, 16.6, 14.9, 15.4, 13.4, 10.7, 9.4, 9.7, 8.9, 10.1, 10.3,
            9.5, 9.4, 9.2, 8.5, 6.5, 6.3, 6.7, 6.9, 6.9, 6, 5.2, 4.5, 4.3,
            4.7, 3.5, 3.1, 3.1, 2.8, 2.2, 1.8, 1.1, 1.8, 0.8, 1, 1.9, 0.3,
            0.2, 0.4, 0.9, 0.9, 1, 0.9, 0.5, 1.3, 1.4, 1, 0.5, 1.3, 1.7,
            1.7, -0.1, 0.1, 0.8, 1, 2, 2, 1.4, 2.7, 2.3, 2.4, 2, 2, 3.2,
            2.8, 1.7, 1.4, 0.5, -0.4, 0.1, -1, -1.4, -1, -0.9, -0.9, -1.8,
            -1.9, -1.1, -0.9, -0.8, -0.3, -0.8, -1, -0.8, -1.3, -1, -1.3,
            -1.2, -1.2, -0.9, -0.6, 1, 1, 1.8, 2.2, 3.1, 3.1, 2.9, 2.8, 2.9,
            3.2, 3.3, 3.2, 1.9, 2, 1.8, 2.3, 2.6, 3, 2.9, 3, 3.5, 3.4, 3.1,
            3.4, 3.6, 3.7, 4.4, 4.2, 3.3, 3.7, 4.4, 4.6, 4, 4.4, 4.7, 4.9,
            5, 5, 5.1, 5.5, 7.1, 7.6, 7.9, 8.2, 10, 10.9, 11.4, 11.9, 12.3,
            12.7, 12.4, 12.2, 11.3, 10.7, 9.2, 8.5, 9.5, 8.5, 7.4, 5.9, 4.9,
            3.9, 2.6, 2.2, 2.3, 1, 1.3, 1.2, -0.3, -0.6, -0.4, 0.2, 0.5,
            0.9, 1.8, 1.8, 1.8, 2.6, 2.5, 3.6, 2.8, 3, 3.7, 4.4, 5, 4.8,
            4.6, 4.4, 4.7, 4.2, 4.4, 3.5, 3.4, 3.7, 3.7, 3.3, 2.6, 2.6, 2.9,
            3.4, 3.3, 3.2, 2.8, 2.9, 2.7, 2.3, 1.6, 1.4, 1.5, 1.3, 0.6, 0.5,
            0.5, 0.5, 0.6, 0.5, 0.2, 0.3, 0.4, 0.3, 0.1, 0.3, 0.5, 0.3, 0,
            0.3, 0.4, -0.1, -1.4, -1.5, -1.1, -0.6, 0, -0.2, -0.2, -1, -0.8,
            -0.4, -0.5, -0.2, 0.7, 0.5, 0.8), .Tsp = c(1996, 2016.16666666667,
                                                       12), class = "ts")

arima(df, order = c(1, 0, 0))

> Call: arima(x = df, order = c(1, 0, 0))
>
> Coefficients:
>          ar1  intercept
>       0.9986    14.2496 s.e.  0.0018    13.6263
>
> sigma^2 estimated as 0.6027:  log likelihood = -286.21,  aic = 578.42

tseries::adf.test(df, k = 0)

>   Augmented Dickey-Fuller Test
>
> data:  df Dickey-Fuller = -5.6878, Lag order = 0, p-value = 0.01
> alternative hypothesis: stationary

