3
$\begingroup$

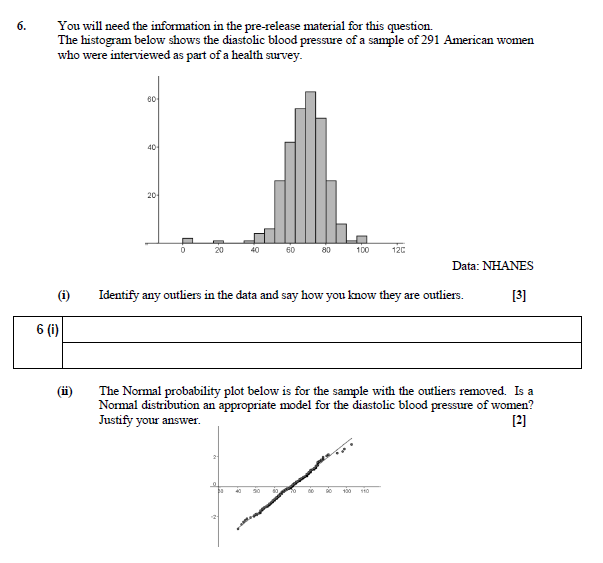
I am a teacher that will be teaching about Normal Probability Plots. This topic is new to me and I would be grateful for any help. Essentially the specification for the course expects students to identify normality with how straight the line is and nothing else but I'd like to understand further. Here is a question from a sample paper (I hope it is visible). I have a few questions.

Normal plot pic

1) What are the axes labels? I have tried background research and I've seen different versions but none like this.

2) How is it calculated and drawn? I'd appreciate a basic explanation. I have an underlying belief it has something to do with $Z=\frac{X-\mu}{\sigma}$ being a straight line for fixed $\mu$ and $\sigma$ but the various types of diagrams is sending me in circles.

I know about the Normal distribution at least as far as the basics.

Thanks for any help. Please forgive if this is a repetition (I did try to search but questions were more complex than I require)

Edit

I have found how it was plotted but would still like to understand why the straight line shows normality.
Edit2

If I used the CDF for a different distribution (Poisson) would a straight line show a poisson dist?

Edit3

I think I understand now and will put a worked example as an answer when I've chance (might be a day or two).

$\endgroup$
7
  • 1
    $\begingroup$ 1. See this question and its answers. 2. Given the nature of your question has changed, and assuming you don't still have answers here after reading that link, can you please edit out the questions that you now understand and just focus on what you want to know? $\endgroup$
    – Glen_b
    Commented Jun 13, 2016 at 10:54
  • 1
    $\begingroup$ For additional background (not necessarily required before you update), you might like to look at some of the questions here. $\endgroup$
    – Glen_b
    Commented Jun 13, 2016 at 11:00
  • $\begingroup$ Different software packages make different choices about which axis to use for which variable so be careful that any description matches what your software does. $\endgroup$
    – mdewey
    Commented Jun 13, 2016 at 11:12
  • $\begingroup$ I think I now understand. $\endgroup$
    – Karl
    Commented Jun 13, 2016 at 11:27
  • $\begingroup$ The last question (the one in edit2) may not be covered by what I pointed to $\endgroup$
    – Glen_b
    Commented Jun 13, 2016 at 12:30

1 Answer 1

1
$\begingroup$

Here is a worked version of my problem.

The data is made up but I hope to have answered my question.

We can create a table of percentiles. We assume that the 3rd data value will have $38\%$ less than or equal to it. $$\begin{array}{c|c}x&25&32&41&52&62&71&80&81 \\ \hline \text{Position when ordered}&1&2&3&4&5&6&7&8 \\ \hline \text{Percent}\le \text{Position }&13&25&38&50&63&75&88&100\end{array}$$

There is no greatest value for the Normal Distribution so using the percentages as it fails.

We can get around this by taking the midpoints of the percentages.

$$\begin{array}{c|c}x&25&32&41&52&62&71&80&81 \\ \hline \text{Position when ordered}&1&2&3&4&5&6&7&8 \\ \hline \text{Midpoint of Percent}&6&19&31&44&56&69&81&94\end{array}$$

We now find the $z$ such that $P(Z\le z)=\text{Midpoint of Percentage}$ $$\begin{array}{c|c}x&25&32&41&52&62&71&80&81 \\ \hline \text{Midpoint of Percent}&6&19&31&44&56&69&81&94 \\ \hline P(Z \le z)=\text{Midpoint of Percentage} &-1.53&-0.89&-0.49&-0.16&0.16&0.49&0.89&1.53 \end{array}$$

The Normal Percentage Plot now graphs $(x,z)$

Now $\mu=55.5$ and $\sigma=20.12$ so we can graph the straight line $z=\frac{x-\mu}{\sigma}$.

If the plot of $(x,y)$ resembles the line of $z=\frac{x-\mu}{\sigma}$ then the data is looking likely to be Normal.

Is this correct? If this needs adding to the question I will do so. If alterations are necessary I'd be grateful for any adjustments.

I have a slight doubt about assuming $38\% \le \text{3rd position}$. In particular I see this is fine when trying to used the CDF of the normal distribution as it is symmetrical but don't see how it can be adapted to test for other potentially non symmetrical distributions such as Poisson.

I have tried to express my understanding as best as I could and apologise if it is garbled.

$\endgroup$
4
  • 1
    $\begingroup$ All normal distributions are similar to each other, so the normal plot would look the same (subject to adjusting the scales) regardless of whether you compute probabilities based on the standard normal or any other normal with different mean and variance. The Poisson distributions have different appearance for different values of $\lambda$, and hence you'd have to pick a particular value to construct your plot. Even then, you'd have to be a bit careful, since the Poisson distribution is discrete. $\endgroup$ Commented Jun 13, 2016 at 17:37
  • $\begingroup$ @user3697176 I'd be grateful if you can confirm my reasoning correct at least for testing for normality. I understand (I think) that plotting Z scores wasn't necessary and the X values aligning with the cumulative probabilities would've sufficed. Thanks. $\endgroup$
    – Karl
    Commented Jun 15, 2016 at 14:41
  • $\begingroup$ I don't want to turn this into chat... Basically, as you observed, you chop the range of possible values up into (in this case) eight intervals, from the 0th to 12.5th percentile, the 12.5th to 25th, and so on.The smallest observed value would then be expected to lie in the first range, and you pair it with the 6.25th percentile. The second smallest observation is expected to lie between the 12.5th and 25th percentile, and you associate it with the 18.75th, etc. If the distribution is normal, then you would expect the plot of observations vs. associated percentiles to be a straight line ... $\endgroup$ Commented Jun 15, 2016 at 21:15
  • $\begingroup$ ...and the straight line approximation should get better and better the more points you use. This approach works for any continuous distribution, but the Poisson distribution is discrete, so the CDF will have jumps, and the observations will be expected to have ties. This requires a different approach. HTH. $\endgroup$ Commented Jun 15, 2016 at 21:19

Your Answer

By clicking “Post Your Answer”, you agree to our terms of service and acknowledge you have read our privacy policy.

Not the answer you're looking for? Browse other questions tagged or ask your own question.