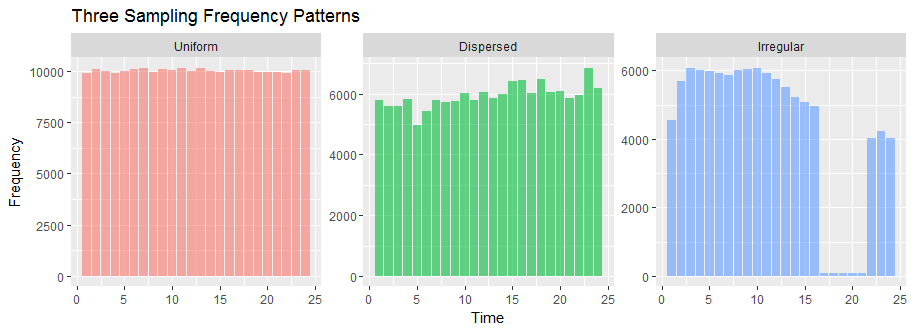
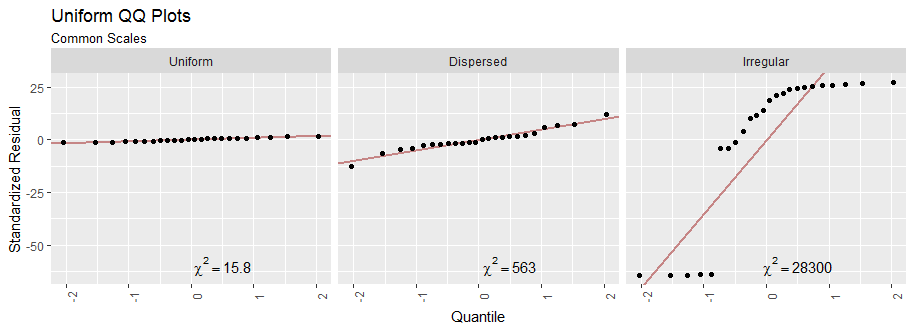
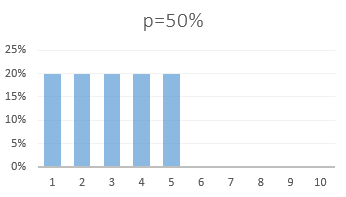
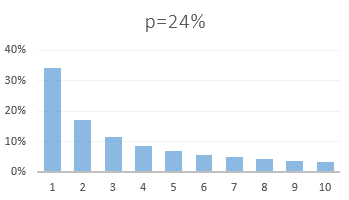
I am not sure what you are after. Whether you need some test as well (ChiSquare might do it)?
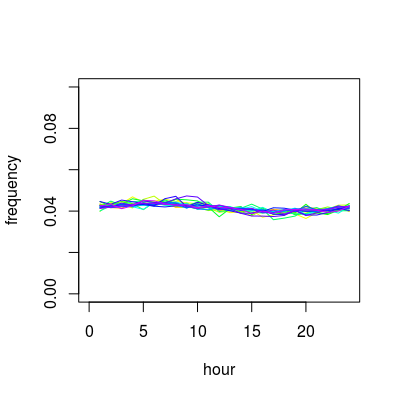
Anyway. To explore this kind of data I would plot a line graph of multiple frequency distributions as a function of time (for different periods).
So 'frequency' instead of 'absolute numbers' such that the variation in amount of events per period does not have an effect.
Numeric example:
say you start from some table of period x time (I use dummy data, but you could make such a thing with your data)
rand_table <- matrix(qnorm(runif(24*20,0,1),200,5),24)
day_effect <- sin(c(1:24)/12*3.14)*10
year_effect <- runif(20,-100,100)

table <- rand_table + matrix(rep(day_effect,20),24,byrow=0) + matrix(rep(year_effect,24),24,byrow=1)
colnames(table) <- (1997:2016)
table

          1997     1998     1999     2000     2001     2002     2003     2004     2005     2006     2007     2008     2009     2010     2011     2012     2013     2014     2015     2016
 [1,] 260.0667 233.5953 120.2019 173.8588 256.3401 204.9747 177.7684 151.1975 138.7639 177.9552 240.7447 205.3817 265.8322 283.5408 262.5569 270.4157 174.4056 128.5618 290.2204 211.4510
 [2,] 249.5244 239.8960 120.5107 192.3158 253.0286 213.0315 169.0203 151.1792 148.4686 189.3689 243.1242 208.7573 262.9110 284.1739 258.1356 277.2521 169.0257 126.3684 294.5213 215.3311
 [3,] 247.9368 241.0808 122.3087 187.8790 254.8316 221.1269 171.4014 153.3314 141.9503 190.8465 245.8284 215.3114 267.7581 293.8443 261.3726 280.1178 177.0729 132.3668 297.9602 204.8105
 [4,] 259.6248 236.9574 131.4456 181.1347 254.8909 215.5816 167.8606 162.4480 143.0204 197.6665 248.4771 207.5274 261.8768 288.2050 262.8231 279.2299 173.8911 128.8646 304.1465 211.6245
 [5,] 258.5498 235.3907 124.2587 199.1903 256.9186 201.3183 175.2693 158.9103 150.4161 199.6419 245.8176 201.3408 267.2395 296.9404 271.8963 281.5610 170.9048 135.5900 307.9319 225.0224
 [6,] 254.2567 238.7180 125.5673 206.0158 258.8102 218.9670 173.4169 156.2924 145.0003 194.5099 252.9973 217.6832 264.4040 290.2716 267.9381 276.0918 166.2304 133.1175 307.3783 223.6769
 [7,] 263.8015 240.6280 128.1640 189.2185 260.7813 213.8075 179.2625 153.9522 150.5207 192.3161 245.8665 216.3049 275.7316 299.2184 271.1639 273.7122 179.7725 132.4717 304.0137 216.3689
 [8,] 251.1121 229.2925 125.1061 199.1912 251.5387 213.5779 173.9617 161.8092 143.6716 191.9641 245.3583 219.0199 266.3403 297.8517 271.8039 277.2551 184.1632 138.4491 303.5132 212.9774
 [9,] 262.7223 228.7230 123.4121 188.1462 256.0832 214.9447 168.3505 160.6458 141.1269 189.5807 252.1686 211.2347 258.2162 286.4550 257.3694 277.0731 164.2448 142.6826 297.7478 214.7545
[10,] 249.4369 237.1748 121.9888 187.5911 247.8664 205.6249 164.0456 158.7430 146.7741 194.0744 234.6995 208.7744 267.5273 277.2283 269.1293 276.5450 172.7910 141.0752 290.0011 206.9505
[11,] 251.5613 232.9232 122.3697 181.4821 239.0499 212.5056 166.7117 148.2396 146.7692 184.4266 242.7564 213.7748 259.5819 274.8612 259.7164 279.9896 167.4115 128.5881 295.3626 212.8600
[12,] 254.9230 220.9191 114.5943 171.9050 242.3551 209.4729 168.1985 131.6664 131.7506 182.0200 243.0256 204.5998 256.6656 282.8597 265.3859 272.2841 161.0621 122.4714 301.9434 207.6163
[13,] 244.3254 220.8979 109.9595 174.6536 247.1941 207.7537 165.4744 145.6344 133.9057 185.2712 242.3778 198.1467 255.9428 271.8196 257.6499 269.8779 156.8241 124.0382 294.1261 207.0789
[14,] 244.6379 222.5761 111.4693 174.1807 247.1866 194.8534 168.4106 143.9778 137.0152 179.4115 233.5407 201.8264 260.9790 279.9378 249.5447 267.6091 152.3627 117.3667 285.6467 202.8995
[15,] 241.6316 224.1021 113.3249 164.2898 242.0647 203.1320 152.5925 139.5406 143.6150 182.4157 229.9307 207.7646 253.3011 273.1239 254.5200 267.1596 152.2835 113.4475 290.8282 193.2609
[16,] 236.1205 217.1519 103.7728 177.2118 235.3146 196.6978 165.7939 138.1489 135.7740 179.4173 240.3620 196.5932 251.1842 276.0529 242.9755 259.4906 157.0868 113.2675 277.5009 198.8784
[17,] 244.0012 224.7148 106.9760 172.4818 237.0167 197.9934 152.9706 140.7621 118.6633 176.8517 227.0027 191.5034 248.9712 265.6904 242.9542 271.0733 150.5976 112.6630 284.8537 193.8020
[18,] 241.4985 213.2320 111.5817 170.3487 237.5654 188.5293 155.9515 143.3172 121.2416 176.1494 231.1264 198.5020 253.3602 269.5122 251.1248 269.7529 149.3875 114.2572 271.4105 202.0268
[19,] 235.2160 221.5018 108.2831 170.1034 238.3747 200.2492 156.0825 135.2035 124.5123 171.6472 233.6136 204.2768 247.2021 278.7483 247.4591 263.8084 157.1870 121.6157 284.1122 202.8897
[20,] 251.9713 226.7143 102.0953 170.3932 236.9628 199.0248 172.7265 137.3076 134.7663 171.9151 238.1566 188.2712 252.4209 275.7938 262.8806 259.6602 148.8275 114.1513 284.5481 204.1796
[21,] 245.5455 223.6492 109.9065 177.2015 241.7890 193.4855 156.2468 138.8739 138.1672 179.0033 233.4918 197.4053 247.6878 274.7670 251.1480 260.8251 148.7647 118.0140 284.0358 201.4156
[22,] 245.4394 217.7951 115.2334 178.6744 249.4580 204.2626 152.8850 137.1021 130.8307 182.5549 232.3583 200.7744 256.4592 277.6917 248.8487 262.9982 153.6351 122.6311 287.4040 195.8459
[23,] 252.1241 225.9910 113.6773 186.8966 243.3909 208.2465 161.2245 143.8986 133.0586 186.5644 224.3530 205.1357 263.8198 283.8469 255.0983 265.6281 161.3566 128.1783 294.0537 199.1899
[24,] 238.2365 229.5241 117.0020 187.2129 250.2044 208.5918 174.3084 142.9330 133.0209 187.7178 242.7608 209.7624 259.7822 277.7875 256.6742 276.9512 157.4175 125.0456 298.1174 210.7647
and then plot the frequency for each year separately
norm_table <- t(t(table)/colSums(table))

#plot
plot(-100,-100,xlim=c(0,24),ylim=c(0,0.1),xlab="hour",ylab="frequency")
plotcolor <- hsv(seq(0.1,0.8,length.out=20),1,1)
for (i_year in 1:20) {
  lines(x<-c(1:24),y<-norm_table[,i_year],col=plotcolor[i_year])
}
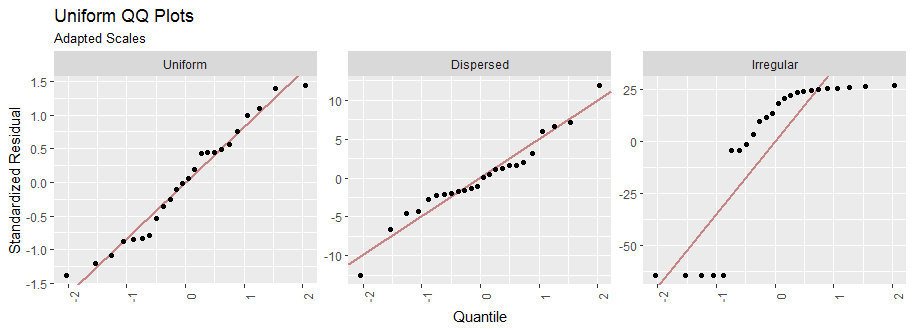
If a reduction to categorical data is fine four your purpose and you'd wish to have a quick test, then you can do a chi-squared-test on the cross table. To see which values are strongest outliers you could plot their variation from the predicted values.


