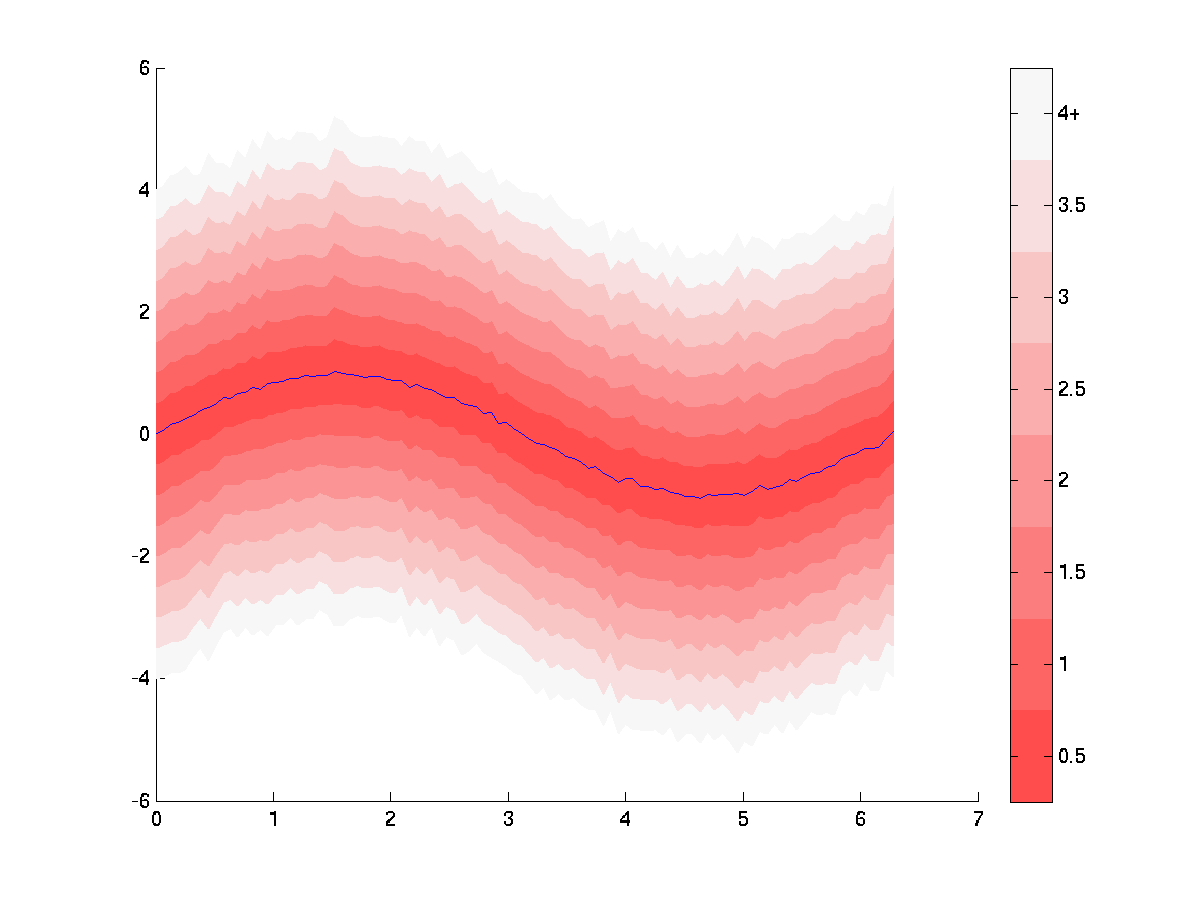
I attached some code that might help get you started. (I am essentially treating your example as being equivalent to displaying confidence intervals around a curve)
X = linspace(0, 2*pi, 100);
X = X';
Y = sin(X);
%scatter(X,Y, '.')

Noise = randn(100, 1000);
data = bsxfun(@plus, Y, Noise);

% Calculate mean and standard deviation
meanData = mean(data, 2);
stdData = std(data, 0, 2);

%%

figure;

% Create multiples of standard deviation
stdevRange = 0.5:0.5:4;
numColormap = length(stdevRange);

% The patch colors will be shades of red
cm = [linspace(1, .97, numColormap);
    linspace(.3, .97, numColormap);
    linspace(.3, .97, numColormap)]';
set(gcf, 'Colormap', cm);
caxis(gca, stdevRange([1 end]));

% Create patch data along with corresponding colors
colorscale = numColormap:-1:1;
pY = arrayfun(@(z) [meanData-z*stdData;flipud(meanData+z*stdData)], fliplr(stdevRange), 'UniformOutput', false);
pY = [pY{:}];
cD = arrayfun(@(z) z*ones(length(X)*2, 1), colorscale, 'UniformOutput', false);
cD = [cD{:}];

% Create confidence bound patches
hCBPatch = patch(repmat([X; flipud(X)], 1, length(stdevRange)), ...
    pY, cD, 'FaceColor', 'flat', 'CDataMapping', 'direct', ...
    'EdgeColor', 'none');

% Plot mean data
line(X, meanData);

% Create colorbar with appropriate labels
stp = range(stdevRange)/(numel(stdevRange)*2);
hColorbar = colorbar;
ytick = stdevRange(1)+stp:stp*2:stdevRange(end)-stp;
yticklabels = cellstr(num2str(stdevRange', '%-g'));
yticklabels{end} = [yticklabels{end}, '+'];
set(hColorbar, 'YTick', ytick, 'YTickLabel', yticklabels);


