9
$\begingroup$

I need to solve a complicated regression problem over the unit disk. The original question attracted some interesting comments, but no answers unfortunately. In meantime, I learned something more on this problem, thus I will try to split the original problem into subproblems, and see if I have better luck this time.

I have 40 temperature sensors regularly spaced in a narrow ring inside the unit disk: enter image description here
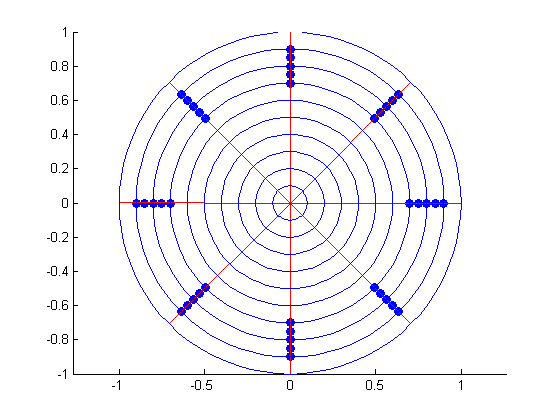
These sensors acquire temperature in time. However, since time variation is much smaller than space variation, let's simplify the problem by ignoring time variability, and assume that each sensor only gives me a time average. This means that I have 40 samples (one for each sensor) and I don't have repeated samples.

I would like to build a regression surface $T=f(\rho,\theta)+\epsilon$ from the sensor data. The regression has two goals:

  1. I need to estimate a mean radial temperature profile $T_{mean}=g_1(\rho)+\epsilon$. With linear regression, I already estimate a surface which is the mean temperature surface, thus I only need to integrate my surface with respect to $\theta$, right? If I use polynomials for regression, this step should be a piece of cake.
  2. I need to estimate a radial temperature profile $T_{95}=g_2(\rho)+\epsilon$, such that at each radial position, $P(T(\rho)<T_{95}(\rho))=.95$.

Given these two goals, which technique should I use for the regression on the unit disk? Of course, Gaussian Processes are commonly used for spatial regression. However the definition of a good kernel for the unit disk is not trivial, so I'd like to keep things simple and use polynomials, unless you feel it's a losing strategy. I've read about Zernike polynomials. The Zernike polynomials seem to be appropriate for regression over the unit disk, since they're periodic in $\theta$.

Once the model is chosen, I need to choose an estimation procedure. Since this is a spatial regression problem, errors at different locations should be correlated. Ordinary Least Squares assumes uncorrelated errors, thus I guess Generalized Least Squares would be more appropriate. GLS seems a relatively common statistical technique, given that there's a gls function in the standard R distribution. However, I've never used GLS, and I have doubts. For example, how do I estimate the covariance matrix? A worked out example, even with just a few sensors, would be great.

PS I chose to use Zernike polynomials and GLS because it seems to me the logical thing to do here. However I'm no expert, and if you feel I'm going in the wrong direction, feel free to use a completely different approach.

$\endgroup$
1
  • $\begingroup$ On the figure, an engine is shown as having a perfect radial symmetry. But does the position of the axes relate to some physical characteristic of an engine, or is it really arbitrary? In the second case, the variable $\theta$ will have only a meaning in relation with a specific engine. $\endgroup$
    – Yves
    Commented Sep 21, 2016 at 4:56

2 Answers 2

2
+50
$\begingroup$

I think you are on the right track in thinking about something like Zernike polynomials. As noted in the answer by jwimberly, these are an example of a system of orthogonal basis functions on a disk. I am not familiar with Zernike polynomials, but many other families of orthogonal functions (including Bessel functions) arise naturally in classical mathematical physics as eigenfunctions for certain partial differential equations (at the time of this writing, the animation at the top of that link even shows an example of a vibrating drum head).

Two questions come to my mind. First, if all you are after is the radial profile ($\theta$ averaged), then how much constraint on the spatial pattern do you need? Second, what types of variability occur in the spatio-temporal data?

In terms of the first question, there are two concerns that come to mind. Due to the polar coordinates, the support-area for each sensor has a trend with $r$. The second concern would be the possibility of aliasing, essentially a mis-alignment of your sensors relative to the phase of the pattern (to use a Fourier/Bessel analogy). Note that aliasing will likely be the primary uncertainty in constraining the peak temperatures (i.e. $T_{95}$).

In terms of this second question, data variability could actually help with any aliasing issues, essentially allowing any mis-alignment to average out over the different measurements. (Assuming no systematic bias ... but that would be a problem for any method, without e.g. a physical model to give more information).

So one possibility would be to define your spatial orthogonal functions purely at the sensor locations. These "Empirical Orthogonal Functions" could be computed via PCA on your spatiotemporal data matrix. (Possibly you could use some weighting to account for the variable sensor support areas, but given the uniform polar grid and target of radial averages, this may not be required.)

Note that if there is any physical modeling data available for "expected" variations in the temperature, available on a dense spatiotemporal computational grid, then the same PCA procedure could be applied to that data to derive orthogonal functions. (This would typically called "Proper Orthogonal Decomposition" in engineering, where it is used for model reduction, e.g. an expensive computational fluid dynamics model can be distilled for use in further design activities.)

A final comment, if you were to weight the sensor data by support area (i.e. polar cell size), this would be a type of diagonal covariance, in framework of GLS. (That would apply to your prediction problem more, although weighted PCA would be closely related.)

I hope this helps!

Update: Your new diagram of the sensor distribution changes things considerably in my view. If you want to estimate temperatures over the disk interior, you will need a much more informative prior than simply "set of orthogonal functions on the unit disk". There is just too little information in the sensor data.

If you indeed want to estimate the spatial temperature variation over the disk, the only reasonable way I can see would be to treat the problem as one of data assimilation. Here you would need to at least constrain the parametric form of the spatial distribution based on some physics-based considerations (these could be from simulations, or could be from related data in systems with similar dynamics).

I do not know your particular application, but if it is something like this, then I would imagine there is an extensive engineering literature that you could draw upon to choose appropriate prior constraints. (For that sort of detailed domain knowledge, this is probably not the best StackExchange site to ask on.)

$\endgroup$
11
  • $\begingroup$ Impressive answer! Need some time to digest it. You ask two questions: I'm not sure I understand the first one ("how much constraint on the spatial pattern do you need?") I thought that using data from all 40 sensors would be better than just averaging along the circumferential direction and then fitting...are you saying this is not necessarily true? For the second one ("what types of variability occur in the spatio-temporal data"), in the next one or two days I'll analyze the first engine (I actually have 5 of them! but this will be the topic of a future question...) ctd... $\endgroup$
    – DeltaIV
    Commented Sep 18, 2016 at 22:19
  • $\begingroup$ ...ctd, I will normalize the data and I will see what I can publish on a public site. Some spatial patterns and some time series...I think they should give you an idea concerning what you're asking. $\endgroup$
    – DeltaIV
    Commented Sep 18, 2016 at 22:20
  • 1
    $\begingroup$ For my first question: If your final aim is to essentially "predict sensor results for a new engine" (inferred from your other question), then do you really need any information from "between the sensors"?. My comment on aliasing was an example of why you would need such information, e.g. if $T_{95}$ is not reliably measured at the sensors. $\endgroup$
    – GeoMatt22
    Commented Sep 18, 2016 at 22:25
  • 1
    $\begingroup$ BTW if this is a design problem, and there are associated CFD-type simulations, then that is significantly more information than implied by the current question. (For example, approaching the problem as data assimilation might use different approaches.) $\endgroup$
    – GeoMatt22
    Commented Sep 18, 2016 at 22:30
  • $\begingroup$ Your answer makes me think: instead of regression, is there some 2d equivalent of a discrete Fourier transform that could be done? E.g. taking the integral of the data points times the n-th Bessel function (appropriately modified), and then getting an orthogonal decomposition? Concerns here would be 1) finding the appropriate discrete-ized function, possibly along the same lines as your answer, and 2) whether this would be too sensitive to the small number of sampling points and the decomposition would lean on more complicated higher order terms. $\endgroup$
    – jwimberley
    Commented Sep 19, 2016 at 13:46
2
$\begingroup$

The Zernlike polynomials don't sound like a bad choice, since they already have $r$ and $\theta$ dependence and orthogonality cooked in. However, since you're studying temperature, an arguably more appropriate and better known choice would be the Bessel functions. These come up in the study of heat flow in cylindrical objects / coordinate systems, and so there's a chance that they are physically more appropriate. The n-th Bessel function would give the radial dependence associated with a corresponding trigonometric function for the polar dependence; you can find the details in many physics and PDE textbooks.

$\endgroup$
5
  • $\begingroup$ (+1) The polar-coordinates heat equation connection is a good one. Another one perhaps worth mentioning is that for Gaussian Processes I know commonly on rectangular grids the covariance matrix is circulant, and practically FFTs are used. So Bessel functions would be a likely candidate for a similar approach on a polar grid. $\endgroup$
    – GeoMatt22
    Commented Sep 18, 2016 at 22:05
  • $\begingroup$ An interesting suggestion! However, I'm measuring the temperature in the operating fluid, not in the solid part of the engine. Thus I'm interested in the convection problem, as opposed to the conduction problem. Bessel functions are surely solutions of the heat conduction (Fourier) equation, but I don't think they're solution of the heat convection equation too, since convection depends on the fluid flow field. Anyway, I could at the very least test them vs the Zernike. What about GLS? Could you add something on that part of the question too? $\endgroup$
    – DeltaIV
    Commented Sep 18, 2016 at 22:11
  • $\begingroup$ @DeltaIV I'm not too familiar with GLS, but one question -- why do you expect errors to be correlated at different spatial points? I agree that real fluctuations will be correlated between points, but I would think that errors (i.e. uncertainty in the sensor readings) would be uncorrelated. Perhaps for the regression fluctuations count as errors? I am considering adding something about penalization terms, however. Whatever basis you use, you have only a finite number of sampling points and could find some very high order matching Bessel function, so the lowest-order terms should be preferred. $\endgroup$
    – jwimberley
    Commented Sep 19, 2016 at 13:36
  • $\begingroup$ @DeltaIV Regarding fluctuations again, which would introduce correlations between the spatial points: your object is to get a temperature map, is it not? Don't you want to see whatever fluctuations are occurring? And could a statistical model even account for them, since the fluctuations would be driven by fluid dynamics and be complicated in space and time? (Is this related to the time-dependent part of your analysis that you've left off for simplicity?) $\endgroup$
    – jwimberley
    Commented Sep 19, 2016 at 13:41
  • $\begingroup$ gallery chat created. $\endgroup$
    – DeltaIV
    Commented Sep 19, 2016 at 14:28

Your Answer

By clicking “Post Your Answer”, you agree to our terms of service and acknowledge you have read our privacy policy.

Not the answer you're looking for? Browse other questions tagged or ask your own question.