1
$\begingroup$

I have a 10 years daily data series, with no indicative trend on the first 8 years but seemingly exponential growth in the last 2.

I’m using R with forecast package.

auto.arima recommends:

ARIMA(0,0,2)SARIMA(2,1,0,)[12]+drift=0.25

Note that no first difference is recommended. I worry that my future forecast (using this model) will not fairly account for the exponential growth witnessed for the past 2 years, since the drift=0.25 is an under representation of trend? Is my worry unfounded because differencing effectively remove trend. Otherwise please advise what can I do about it?

It’s not a structural break, but perhaps a “time varying parameter” (according to Prof. Rob Hyndman – but how can I do that? http://robjhyndman.com/hyndsight/structural-breaks/ – any easy solutions/references to this?) P.s. I could only answer this question if my mathematics is good enough…thanks in advance.

$\endgroup$
3
  • $\begingroup$ post your data. $\endgroup$
    – Tom Reilly
    Commented Sep 29, 2016 at 22:07
  • $\begingroup$ Here it is. drive.google.com/file/d/0ByCyXOvVti6yVS1FY05MSEpkTWM/… $\endgroup$ Commented Sep 30, 2016 at 16:07
  • $\begingroup$ Note that I have averaged the daily series into monthly data, that's why seasonality is shown as 12. My primary concern is whether the drift recommended by the model (which took account of the data structure of the full 10 years) actually under-represents the seemingly exponential growth in the last 2 years. I'm confused because with the coefficients weights in MA(2) and drift, the exponential trend should be accounted for right? (or if the data has been first differenced instead, the exponential trend should also be accounted for as well right?). My residuals are stationary. $\endgroup$ Commented Sep 30, 2016 at 16:14

1 Answer 1

0
$\begingroup$

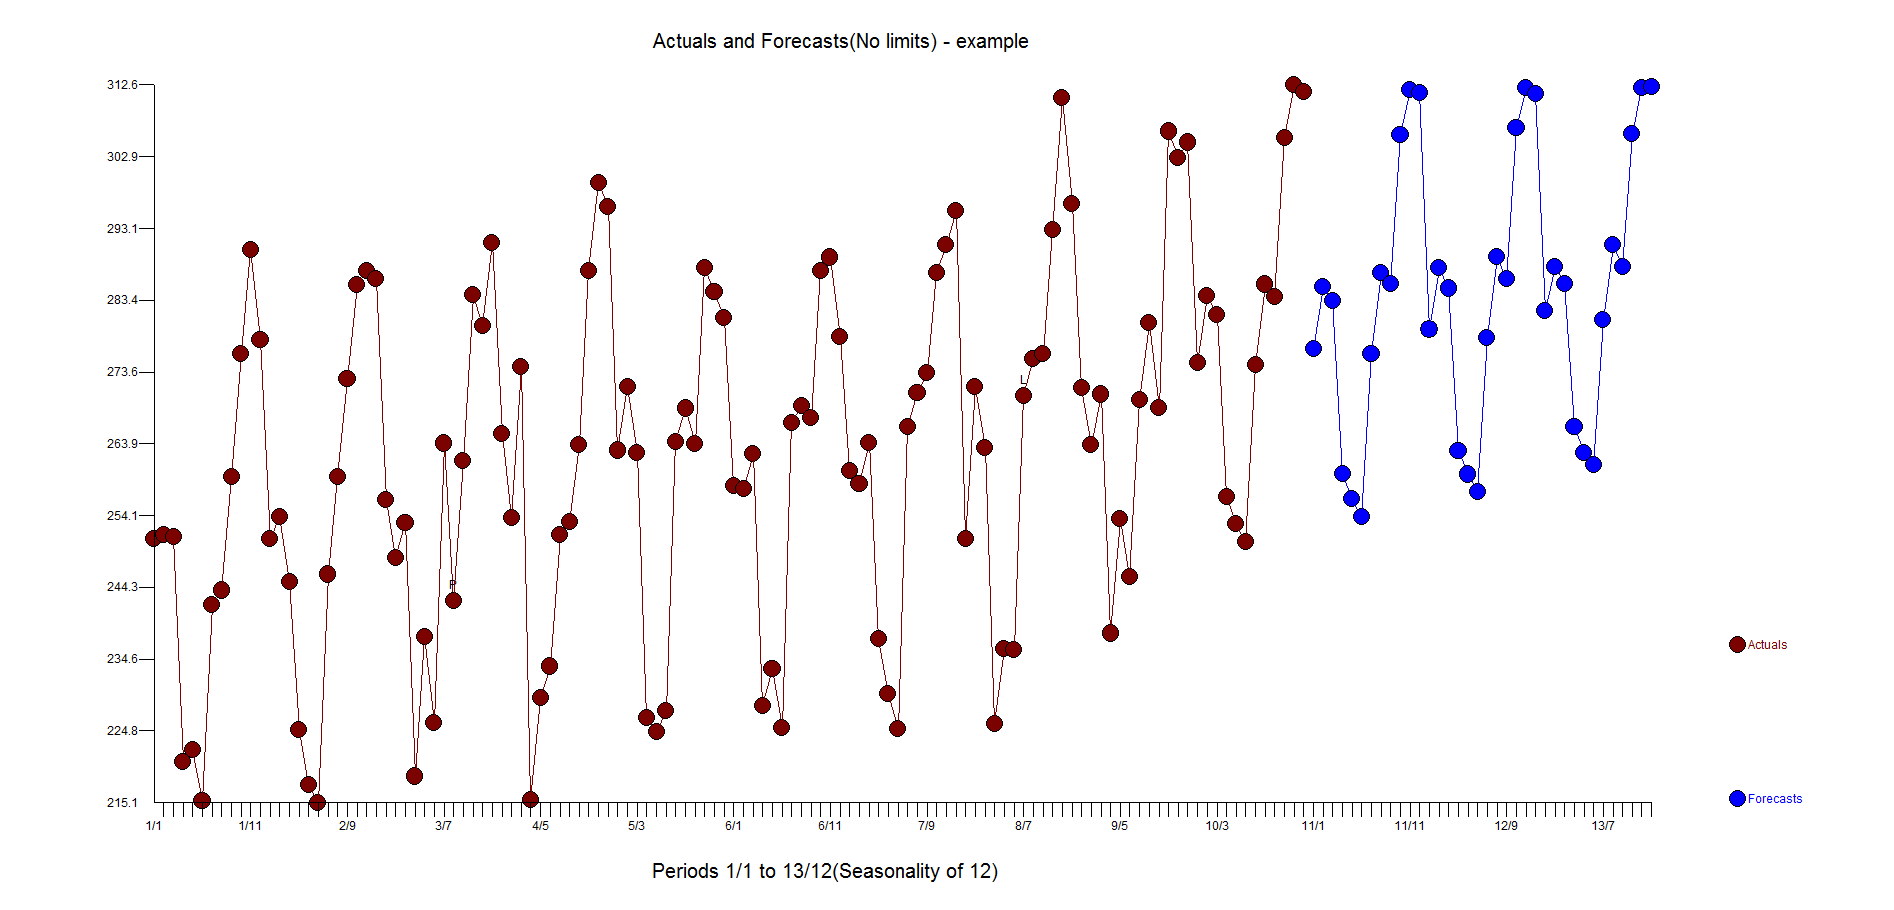
You say the data is daily, but you posted monthly. I ran the data through Autobox(a software I am affiliated with ) and a level shift is identified at period 91. The term "exponential growth" doesn't seem to be likely, but more of a trend change in the intercept. An intercept, strong AR12 and one outlier (at period 32) was identified and added to the model. The Tsay test for changes in variance was strongest at period 60 with an alpha of .052, but our test only flags at .01 so no weighted least squares fix was applied.

Model

Actual and Forecast

$\endgroup$
4
  • $\begingroup$ Thanks for the comprehensive response Tom. I averaged the daily data to monthly to simplify things further. But I'm unable to fully understand some of the output. Did the prediction account for the change in trend from period 92 by cutting off the data from 1-92? $\endgroup$ Commented Sep 30, 2016 at 17:25
  • $\begingroup$ Hu-No, it uses all of the data. A level shift variable (ie 0,0,0,0,0,1,1,1,1,1 etc) was added to the model automatically. See this paper jstor.org/stable/1391308?seq=1#page_scan_tab_contents $\endgroup$
    – Tom Reilly
    Commented Sep 30, 2016 at 17:59
  • $\begingroup$ If you like my answer, give it a "check". $\endgroup$
    – Tom Reilly
    Commented Oct 4, 2016 at 20:16
  • 1
    $\begingroup$ Sorry didn't know i could do that. Upvoted. Thanks, sincerely. $\endgroup$ Commented Oct 5, 2016 at 14:07

Your Answer

By clicking “Post Your Answer”, you agree to our terms of service and acknowledge you have read our privacy policy.

Not the answer you're looking for? Browse other questions tagged or ask your own question.