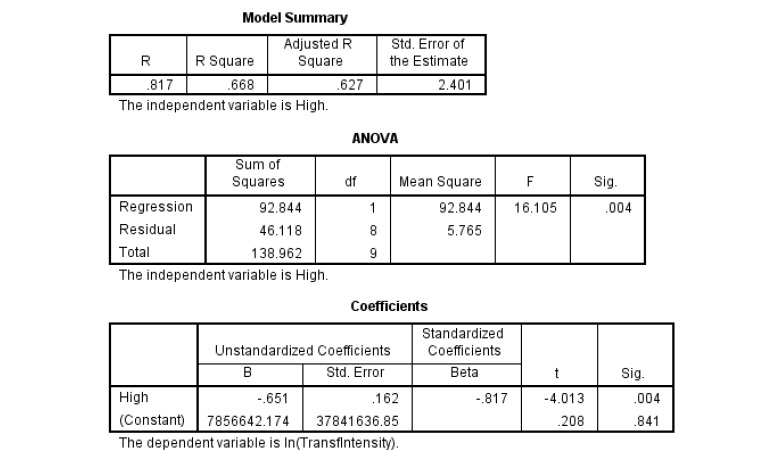
I am analyzing Log+C transformed intensity data with temperature. I was advised to do a curve estimation regression analysis in SPSS, examining an exponential relationship but I am not sure how to interpret my output. My sample size is small- only 10, but the relationship, the curve, appears strong to me. Here is my output with the exponential model 
$\begingroup$
$\endgroup$
1
-
2$\begingroup$ Your tables look not at all like those from SPSS Curve estimation procedure. Are mixing something up? $\endgroup$– ttnphnsCommented Oct 11, 2016 at 8:11
Add a comment
|
1 Answer
$\begingroup$
$\endgroup$
That looks exactly like the CURVEFIT (Analyze > Regression > Curve Estimation) output to me. It is the estimates for the regression of ln(Transfintensity) on High, i.e.,
ln(Trnsfintensity) = 7856642 - .651 * High.
so exponentiating both sides gives
Transfintensity = e**(7856642 - .651 * High).
There is an optional plot with this procedure that might help you understand the equation
