Thanks for posting the data.
The original data look in good and surprisingly simple shape for environmental data. What sampling or selection process underlines what we see here? Nor is there any obvious need for transformation to capture nonlinearity or other awkwardness.
I have ignored the missing values in your data.
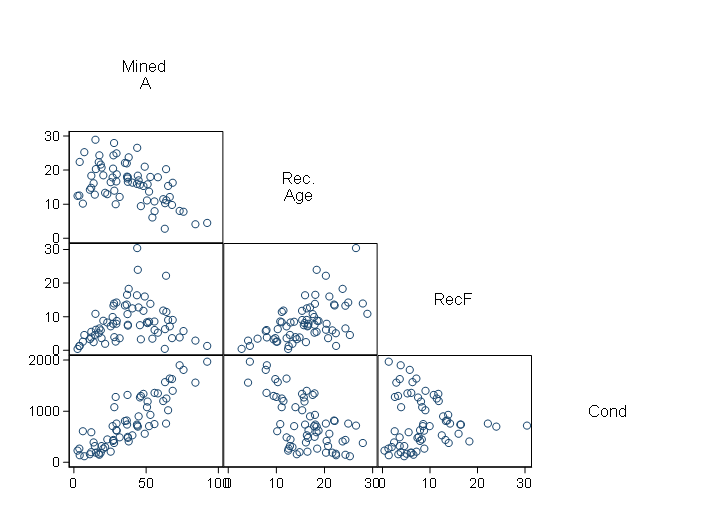
A scatter plot matrix suggests that Mined A is likely to be the best predictor, and then Rec. Age. That picture could be complicated by the relationships between different predictors.

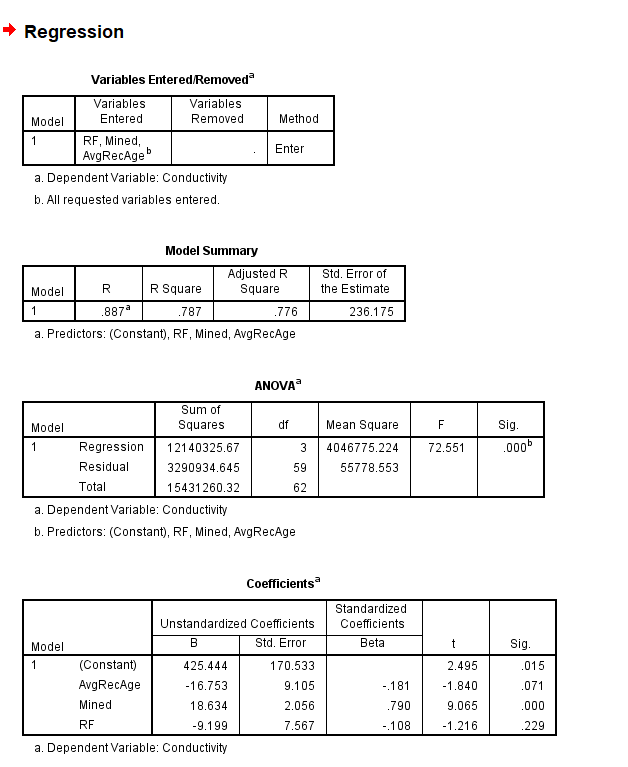
I'd suggest that a two-predictor regression is a much better choice than your three-predictor model. It would not a good idea to force RecF into the model: its relationship with Rec. Age just muddies the waters if both are included. Presumably the results from Stata here will match what you can get from SPSS. The story from $R^2$, $P$-values and residual and added variable plots (not shown here) all support stopping with two predictors.
An RMSE can't be interpreted without knowing the units of measurement and the original SD of the outcome variable.
Substantive interpretation remains the responsibility of the researcher. Does the sign of each coefficient match what you think is happening?
. regress cond mineda recage

      Source |       SS           df       MS      Number of obs   =        64
-------------+----------------------------------   F(2, 61)        =    112.08
       Model |  12431284.1         2  6215642.07   Prob > F        =    0.0000
    Residual |  3382839.29        61  55456.3818   R-squared       =    0.7861
-------------+----------------------------------   Adj R-squared   =    0.7791
       Total |  15814123.4        63  251017.832   Root MSE        =    235.49

------------------------------------------------------------------------------
        cond |      Coef.   Std. Err.      t    P>|t|     [95% Conf. Interval]
-------------+----------------------------------------------------------------
      mineda |   17.22542   1.576469    10.93   0.000     14.07308    20.37777
      recage |  -24.43057   6.293212    -3.88   0.000    -37.01462   -11.84651
       _cons |   526.0784   143.6132     3.66   0.001      238.906    813.2508
------------------------------------------------------------------------------


