I am trying to publish my Masters thesis which looked at elephant impacts on vegetation, with a focus on the effect of artificial waterholes. I have made my initial submission and am now performing major revision, which involves some questioning of my statistical approaches.
Some of the elephant impact measures I looked at showed a non-linear relationship with distance to water which led me to use GAMs. However, a reviewer has said that they feel this is statistical overkill and achieves little more than "fitting complicated nonlinear functions that demonstrate that distance matters". They suggest I should rather describe non-linear relationships between elephant impacts and distance to water by fitting simple functions which others can use (e.g. exponential decay curves). I think the point being made is that these simpler functions would allow me to say something more generalisable about the elephant impacts (e.g. they resemble a logarithmic curve), while the GAMs are only useful for describing the impacts I found in my particular study area and is thus of less general usefulness.
I'm still a novice at statistics so I would appreciate some thoughts on which approach seems more sensible. I have included some examples from my data below.
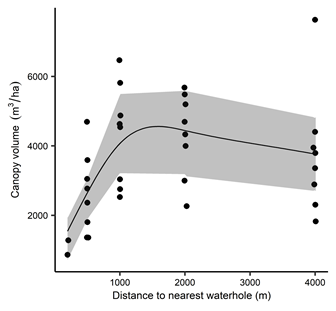
The top graph shows canopy volume/ha in one vegetation type at different distances from water(the circles represent individual sampling plots). The line shows the predicted relationship from the GAM regression. This sort of relationship appears to resemble a logarithmic curve so the reviewer would perhaps recommend I fit that instead in a case like this.
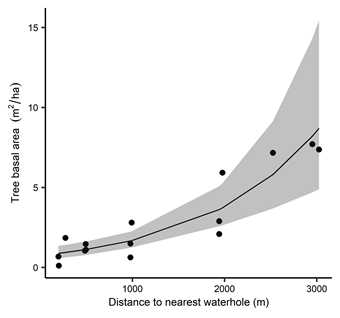
The second graph shows canopy volume/ha in relation to distance to water, but in a second vegetation type. This vegetation type was more heavily impacted by elephants. Again the line on the graph is derived from the GAM prediction, but this could be one where I could look to fit an exponential curve?
I'd appreciate any thoughts on the merits of my use of GAMs versus the reviewer's recommendation to use simpler functions. As an aside, I also have not really explored fitting logarithmic or exponential curves to data in R, so I would also much appreciate any pointers in that regard.


canopy volumevsdistance to waterholeis "canopy volume [...] increased initially with distance from the nearest waterhole, before plateauing at around 1000 m (Fig. 3a and b)." However, plateauing behaviour is not what your GAM is showing but what an asymptotic regression would have showed. Details why? $\endgroup$