6
$\begingroup$

I have a temporally ordered discrete valued data. The only possible states for the data are: {1,2,3,4,5,6}. So the series is something like {1,2,3,5,6,4,3,5,2,......} I want to forecast the next value of the series based on past data.What are the methods appropriate for this?

Now please note that my question is not repetitive. I am aware of this

How to model categorical (discrete-valued) time series?

Wherein people suggested that a HMM or a Markov model would be appropriate. I searched the site for that, downloaded R packages like HiddenMarkov, hmm.discnp, etc. Esp in the later, I used the Viterbi function given and got the most likely sequence of hidden states that led to the generation of observed states, i.e. data given to it.

But that is not what I want! what I want is FUTURE value of the OBSERVED sequence from the PRESENT and PAST values and the Viterbi function does not give that. What is the solution for this?

Also, what other methods are useful for which some packages are available? I read about discrete ARMA methods, but not for multi-class data and then also without any implementation. Is this problem really that hard? Please suggest preferably a software implementation or a method.

$\endgroup$
8
  • $\begingroup$ I believe that I have provided you with a state-of-the-art solution with sufficent detail as no data-based model (compared to a pre-specified assumed model) is currently available. The model I suggested below using your data deals with predicting (low count) discrete valued time series using the history of such a series and any level shifts/local time trends/seasonal pulses/pulses/changes in parameters/changes in variance deemed necessary and sufficient. $\endgroup$
    – IrishStat
    Commented Mar 17, 2012 at 15:49
  • $\begingroup$ So these are absolutely not ordinal data? They do seem to behave that way... $\endgroup$ Commented Mar 17, 2012 at 17:26
  • $\begingroup$ @Conjgate They appear to be ordinal, If they were purely attributes/classes/labels , ARIMA processes would seem to be inapplicable. $\endgroup$
    – IrishStat
    Commented Mar 17, 2012 at 18:40
  • $\begingroup$ It is not ordinal data but purely class labels. $\endgroup$
    – nb1
    Commented Mar 17, 2012 at 22:34
  • $\begingroup$ @NikhilBellarykar What is the interval between the readings ? Is it daily data or is it just random intervals between the readings ? $\endgroup$
    – IrishStat
    Commented Mar 18, 2012 at 11:50

2 Answers 2

6
+50
$\begingroup$

Returning to the discarded HMM approach. An HMM is just a state space model that assumes discrete hidden state. I think you have dismissed the state space approach too soon.

The forecasting question you bring up is quite general for such models which I'll discuss in discrete time formulation, since that's what you've got. (If you happen to know about how Kalman filters work, use that intuition; they're used for very similar state space models when gaussian assumptions apply.)

State and the role of past observations

The basic assumption of any state space model is that the future is independent of the past given the current (hidden) state, and that the observations at a point depend only on the hidden state. Consequently when you have the state you don't need the preceding observed values or states. (And if that isn't enough, you need a formulation with more state...) The state is intended to represent all the relevant information.

Forecasting

Conceptually speaking, to forecast, you start with a distribution over the current hidden state, and you use the estimated transition function -- a transition matrix in the HMM case -- to propagate this distribution forward in time. Once you've moved forward to the point in time where you want to forecast you have a (wider) distribution over the future state. (Alternatively in the HMM case you can find the most likely state to be in then, but you will have neglected quite a bit of uncertainty.) You then generate a predictive distribution over observables by taking a weighted average of the conditional distribution of the observations where the weights are from the distribution over the hidden state.

Basically it's just like filtering, only without tightening up the state estimate on the basis of observations. On cursory glance, the packages you mention don't seem to have a function for more than one step ahead forecasting (because that's needed to compute the likelihood) but now you know what you want to do, you may be able to persuade them to do so, or write the relevant function yourself.

This is described in mathematical detail in a bunch of places, e.g ch. 5 of Zucchini and MacDonald (2008) for the HMM case. They also offer an R implementation. Petris and Patrone (2011) is a more general review of state space model packages in R, including those that work with non-discrete state models. These would be good places to start.

Multivariate state space modelling is not particularly straightforward, but most of the difficulties are numerical and good implementations for the classic models are increasingly available.

$\endgroup$
6
  • $\begingroup$ This is quite interesting to me . Can you please detail your suggested approach with the OP's data. Please show as much detail as you can along with all of your assumptions and the actual forecasting equation. Please provide the arithmetic to show how one actually forecasts out the next 14 periods. $\endgroup$
    – IrishStat
    Commented Mar 17, 2012 at 16:38
  • $\begingroup$ Before thinking about that, I'd like to register a little, umm, concern about the problem setup. Are 1-6 really category labels? It seems a bit suspicious (statistically speaking) that such a neat autocorrelation story fits them. It seems more likely that we are dealing with a continuous process that generates ordinal data: a different (though not totally different) problem... $\endgroup$ Commented Mar 17, 2012 at 17:24
  • $\begingroup$ @ConjugatePrior yes, those are category labels. May I know why are you suspicious about the data being categorical? $\endgroup$
    – nb1
    Commented Mar 17, 2012 at 22:41
  • $\begingroup$ Mostly from the visuals, and because an AR 2 model fits reasonably, which I would not expect from an arbitrary set of numerical labels, though without a permutation check that's not more than curious. And perhaps a little because @IrishStat just flat assumed they were. $\endgroup$ Commented Mar 18, 2012 at 11:37
  • $\begingroup$ @ConjugatePrior you are quite correct I did assume some form of ordinal data. Now if it looks like a duck and quacks like a duck then it might be a duck . It is interesting to both of us how a "random selection" of ordered "labels" could exhibit evidently ordered structure BUT it can happen randomly and might just have happened here. $\endgroup$
    – IrishStat
    Commented Mar 18, 2012 at 14:58
1
$\begingroup$

The airline series is a count series i.e the number of people flying per month. You could consider your series to be also a count series ( in reality it is an attribute/class series) but at a much lower level (1,2,3,4,5,6). Now if you were to identify and estimate an ARIMA model the problem arises insofar as the fitted values ( 1 period out predictions) have not been constrained to be integers which represents a slight problem. I once wrote software to constrain the fitted values to be integers but parameter convergence disappeared. I have studied rare disease data on a monthly basis that was similar to your "count series" and have been able to identify a useful seasonal patterns yielding a prediction which will be a non-integer. Rounding the forecast to an integer serves the purpose of providing predictions that will be integers. One can identify level shifts and/or local time trends in this kind of data and also to some extent anomalies. What I am suggesting is imperfect but until someone tells me a better way , here I stand. I would be more than happy to provide you with an example using existing software if you posted an actual historical series.

REVISED With Data analysis:

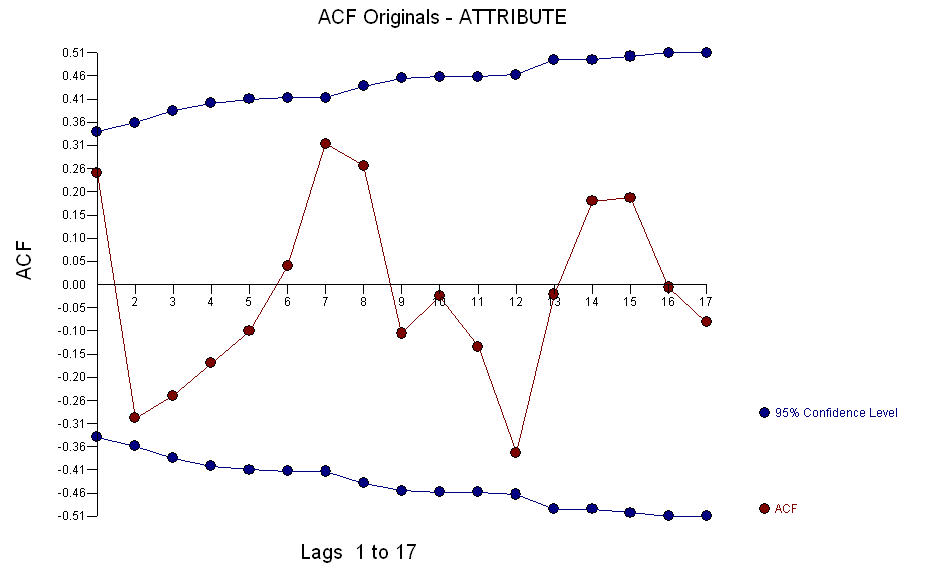
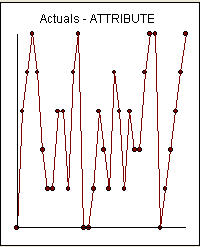
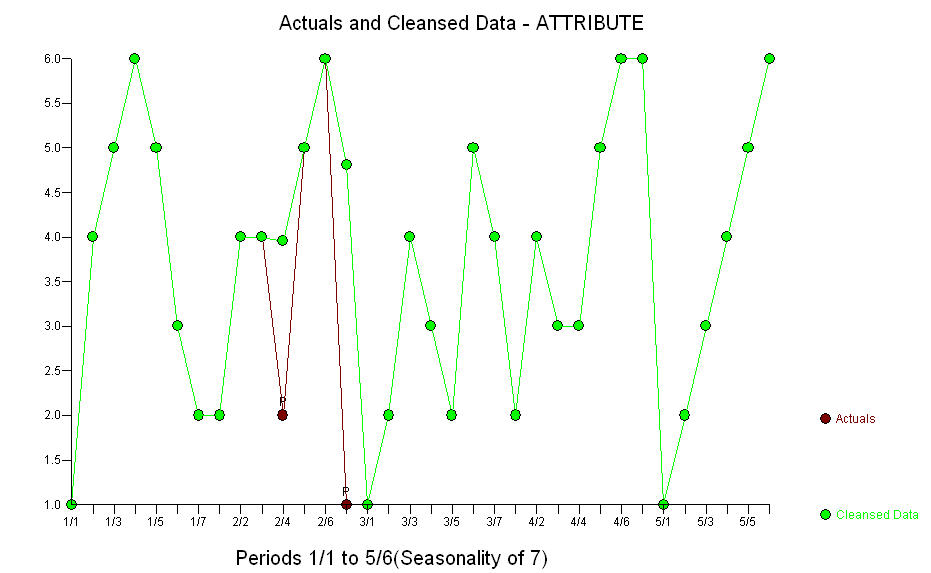
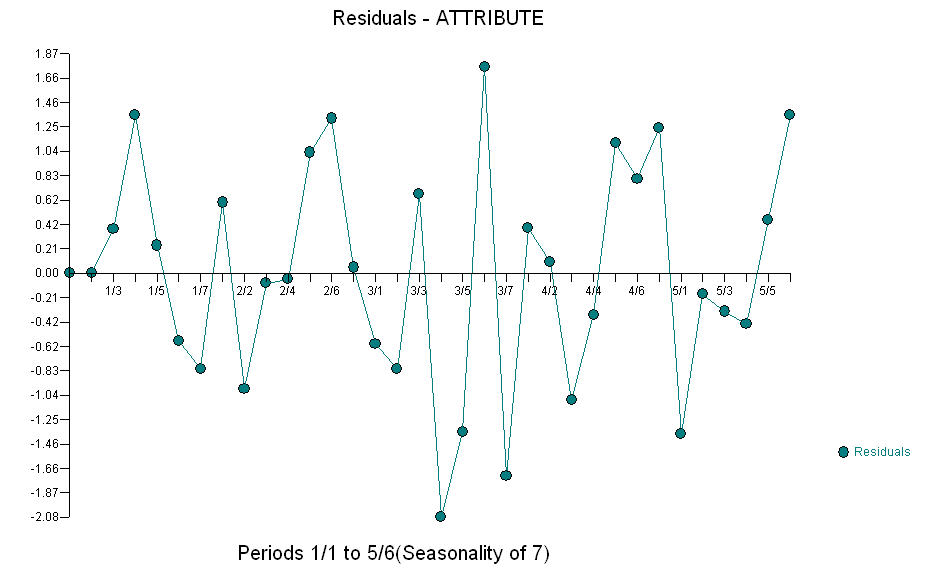
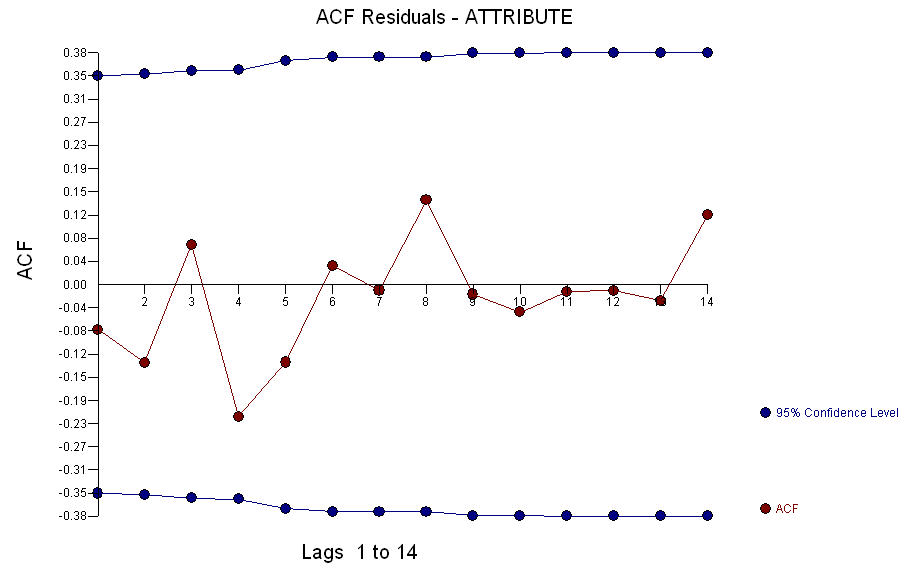
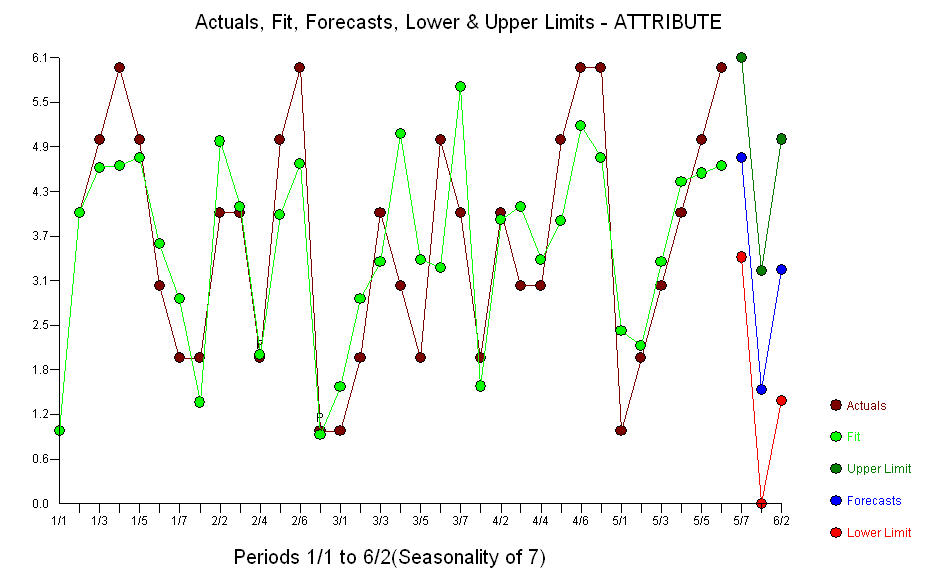
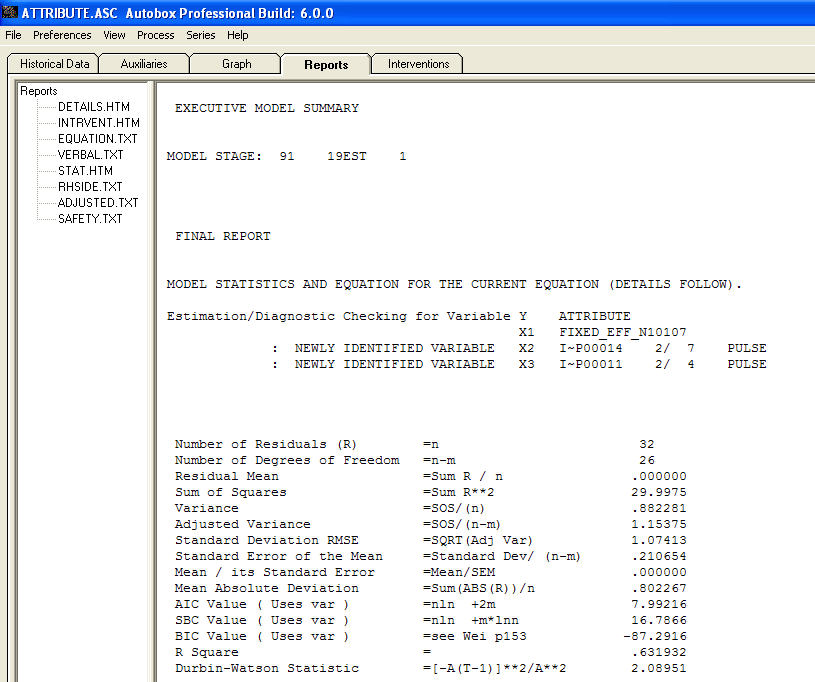
The plot of the 34 data points enter image description here and the ACF of the data enter image description here suggest that the data might be daily as the ACF of lag 7 suggests structure. A model was automatically developed which developed an auto-regressive memory of order 2 and an indicator variable for day 1 of each week with two Pulses ( anomalies) being identified at periods 14 and period 11 enter image description here . The Actual and Cleansed plot illuminate the two unusual data points .enter image description here . The residuals from the model appear visually to be "random" enter image description here and the ACF of the Residuals appears to support that conclusion enter image description here . The actual/fit/forecast plot is shown hereenter image description here . This model can be expressed as Pure Right-Hand Side ala a regression equation enter image description here Note that when predicting the Pulse Indicators play no role as future values of these indicators are expected to be 0 while the future value of the first day of the week will be zero except for the first day of the week. For example if we are predicting out 14 days from period 34 , this would mean 0,1,0,0,0,0,0,1,0,0,0,0,0,0 .Note that all models are wrong but some models are useful ( attributed to G.E.P.Box ) .
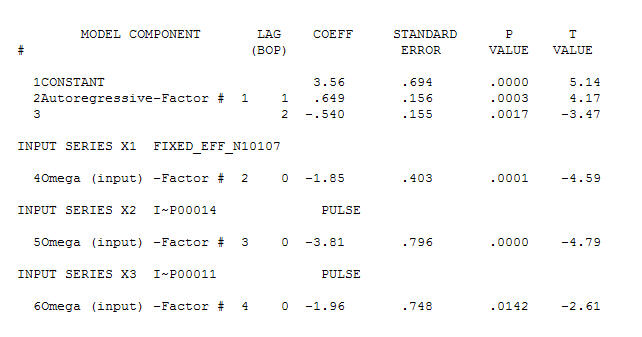
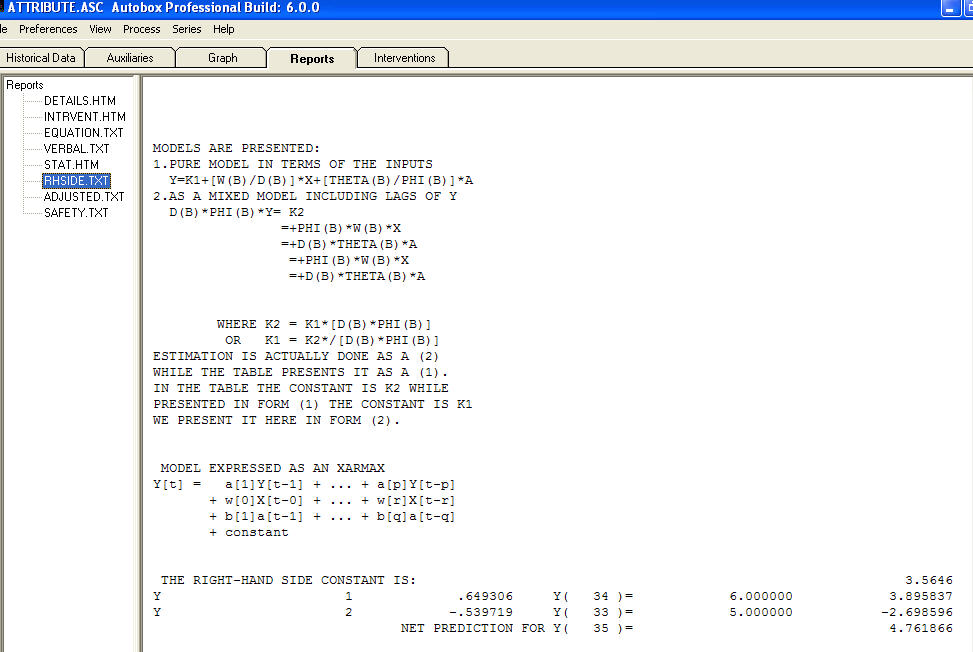
THE RIGHT-HAND SIDE CONSTANT IS: 3.5646 Y 1 .649306 Y( 34 )= 6.000000 3.895837 Y 2 -.539719 Y( 33 )= 5.000000 -2.698596 NET PREDICTION FOR Y( 35 )= 4.761866

The above is a prediction for period 35. Note that you would have to round off the forecasts in order to meet the integer requirements. Thus the prediction would be "5". I hope this helps. In closing here is a summary of the model .enter image description here

$\endgroup$
5
  • $\begingroup$ thanks for the clarification. Now, While I have been able to compute the most probable state sequence, how to perform the actual forecasting? I will appreciate it a lot if you kindly elaborate the forecasting step with maybe an implemented example. $\endgroup$
    – nb1
    Commented Mar 13, 2012 at 15:54
  • $\begingroup$ 1. I suggest that you post your own time series so that it is a real example 2. To learn BOX-JENKINS ARIMA modelling pursue both stats.stackexchange.com/questions/24398/… and my personal favorite stats.stackexchange.com/questions/6498/… – IrishStat just now edit $\endgroup$
    – IrishStat
    Commented Mar 13, 2012 at 18:09
  • $\begingroup$ I know ARIMA modelling, no problem with that. The time series is as follows:(1,4,5,6,5,3,2,2,4,4,2,5,6,1,1,2,4,3,2,5,4,2,4,3,3,5,6,6,1,2,3,4,5,6) $\endgroup$
    – nb1
    Commented Mar 15, 2012 at 20:00
  • $\begingroup$ Thanks a lot for the detailed analysis.I get your point about rounding off the forecasted values. Now, while ARIMA does the trick in this case, what is the guarantee that the forecasts will lie between 1 &6, integer or not? Thus I am interested in models that are SPECIALLY TAILORED for discrete data. $\endgroup$
    – nb1
    Commented Mar 16, 2012 at 14:31
  • 1
    $\begingroup$ @Nikhil There is no guarantee that the forecast will lie between 1 and 6 unless some form of a deterministic trend was found which is to me very unlikely given the nature of your stationary data. Secondly I am unaware of a SPECIALLY TAILORED model for this kind of data. Note also that the ISI has been a customer of ours in the past but I don't believe that they were concerned with your very interesting and well articulated problem statement. You might ask an ISI faculty member who is familiar with time series analysis if they can help you and perhaps share that information with the list. $\endgroup$
    – IrishStat
    Commented Mar 16, 2012 at 16:01

Your Answer

By clicking “Post Your Answer”, you agree to our terms of service and acknowledge you have read our privacy policy.

Not the answer you're looking for? Browse other questions tagged or ask your own question.