5
$\begingroup$

I have a residual vs fitted values plot for the following negative binomial model:

glm.nb(formula = Numberpertow ~ as.factor(CruiseID) + as.factor(Stratum) + 
    offset(log((TowDist * Subsampling_fraction)/1850)), data = news2,link = log)

Numberpertow is discrete count data Cruise and Stratum are catergorical covariates. Cruise has 3 levels and stratum has 23 levels.

The plot below is of the deviance resiuals against the log of the fitted values. I am trying to assess model fit. Based on this plot the residuals dont appear to be centered around zero for larger fitted values and I can see a pattern of decreasing residuals for larger fitted values. I am wondering if there is enough deviation from expectations to not continue with this model. The scale location plot does not indicate heteroskedasticity.
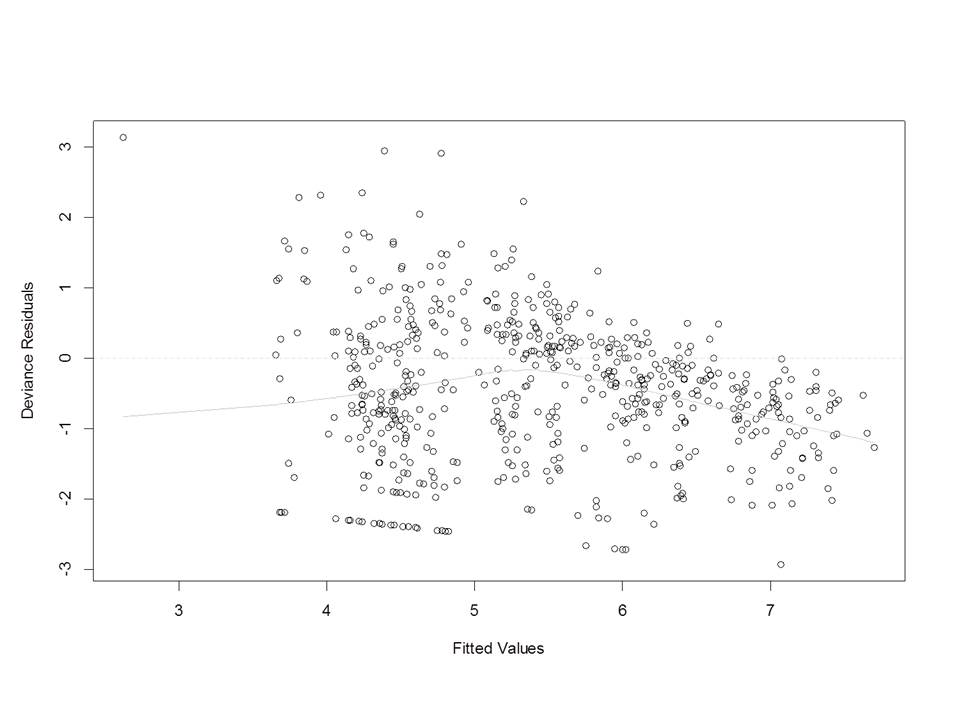
enter image description here.

$\endgroup$
1
  • $\begingroup$ You can see quite noticeable heteroskedasticity in this plot. The scale location plot is only any use if your fit to the mean is good, but you don't have that here, so the scale-location plot is misleading you -- when the mean is not well-fitted, it's better to judge the heteroskedacticity from this plot. $\endgroup$
    – Glen_b
    Commented Nov 21, 2016 at 23:36

1 Answer 1

4
$\begingroup$

It is difficult to assess the fit of the negative binomial (or any other integer-valued GLM for that matter) with deviance residuals, because also a perfectly fitting NB model may exhibit inhomogeneous deviance residuals.

However, you can use the DHARMa R package to transform the residuals of any GL(M)M into a standardized space. Once this is done, you can visually assess / test residual problems such as deviations from the distribution, residual dependency on a predictor, heteroskedasticity or autocorrelation in the normal way. See the package vignette for worked-through examples.

$\endgroup$
6
  • $\begingroup$ Thank you for the suggestion for the DHARMa package. I have been working thought it today. Since my two covariates are categorical do you have a suggestion on how to interpret the plotResiduals plots? I got an error message when I originally tried plotting them vs the simulated residuals that x must be numeric. I converted the variables to numeric values but the graphs aren't what I was expecting. $\endgroup$
    – user41509
    Commented Nov 28, 2016 at 17:21
  • $\begingroup$ Good point, I should add something for categorical predictors. In principle you can plot the scaled residuals as you would for a linear regression - I guess the easiest would be box or violin plots, e.g. boxplot(res$scaledResiduals ~ pred1 + pred 2) - I would set ylim = c(0,1) and keep in mind that the expected Distribution is uniform, so for a good fit the box should be at 0.25,0.75, with the median line at 0.5. $\endgroup$ Commented Nov 29, 2016 at 9:18
  • $\begingroup$ The boxplot code worked great. Based on the vignette and the model diagnostics it looks like I may need to have the dispersion parameter, theta, be dependent on a predictor Stratum in my model. I have been trying to write some code for a Bayesian model in R but am having some issues and getting an error message. Do you have any recommendations for examples for writing R code using JAGS that allows theta to vary by a parameter that you could direct me to? I haven't had much luck in my searches. $\endgroup$
    – user41509
    Commented Nov 29, 2016 at 15:00
  • $\begingroup$ I haven't done this for the NP, but for other distributions, and usually it's straightforward - instead of with the prior, link the dispersion parameter with a lm or glm response (without distribution, only the response term - I guess g / a link is needed to ensure positive values). Note that it may be useful to think about the parametrization of the NB to ensure efficient sampling, see, e.g. doingbayesiandataanalysis.blogspot.de/2012/04/… $\endgroup$ Commented Nov 30, 2016 at 11:24
  • $\begingroup$ A question if you don't mind - this could be an interesting case study to provide in github.com/florianhartig/DHARMa/tree/master/Code/Examples or the vignette - if you would be OK with that, I would need an R or Rmd file including the data (as txt or via dput) that describes you analysis, with any comments / references / acknowledgements you want to make. $\endgroup$ Commented Nov 30, 2016 at 11:32

Your Answer

By clicking “Post Your Answer”, you agree to our terms of service and acknowledge you have read our privacy policy.

Not the answer you're looking for? Browse other questions tagged or ask your own question.