8
$\begingroup$

To start off, please go through this question regarding measuring non-uniformity in probability distributions.

Among several good answers, user495285 has suggested a heuristic of simply taking the L2 norm of a vector whose values add to 1. I've found in my experiments that it actually works very well for most practical applications and is usually performant.

I am now in the process of writing a paper about a machine learning algorithm, which makes use of this heuristic. However, I need to provide at least some background explaining why this heuristic works reasonably well.

Given that taking L2 norms for this purpose is probably just a heuristic, I understand that there might not be a solid theoretical basis, but I nevertheless need an intuition on what could be going on, so that I can at least explain it in the paper and I'm myself clear regarding what's going on. Ideally, if there's a proper explanation available that I can directly cite, kindly share it here.

I looked up the web and could find some documents that talk about using L2 norms in context of measuring uniformity, but I'm not sure if they give an intuitive explanation of why it works and if they are citable. Here are the documents:

  1. Testing Uniformity of Distributions
  2. Ratio and Difference of l1 and l2 Norms and Sparse Representation with Coherent Dictionaries
  3. Sublinear time algorithms

In addition, if you have any additional ideas on how to measure non-uniformity in distributions or you could tell why some measure is better than others, please let me know.

$\endgroup$
1
  • 1
    $\begingroup$ In mining of massive data sets book (mmds.org) it is called the 'surprise number' - and approximate algorithms for calculating it are detailed ( when you don't have space to actually store all the counts) - in stream processing ...original article N. Alon, Y. Matias, and M. Szegedy, “The space complexity of approximating frequency moments,” 28th ACM Symposium on Theory of Com- puting, pp. 20–29, 1996. $\endgroup$
    – seanv507
    Commented Nov 30, 2016 at 18:42

3 Answers 3

10
$\begingroup$

I believe the intended application is that

  • frequencies $f_i$ of $n$ items $i=1,2,\ldots, n$ have been observed; and

  • you are wondering whether these frequencies are consistent with an underlying uniform distribution in which all observations are (a) independent and (b) equally probable.

The "vector" in question is the normalized tuple of relative frequencies,

$$p = (p_1, p_2, \ldots, p_n) = \left(\frac{f_1}{f}, \frac{f_2}{f}, \ldots, \frac{f_n}{f}\right)$$

with $f = f_1 + f_2 + \cdots + f_n$ being the total number of observations. The $L_2$ norm of $p$ is, by definition, the square root of

$$||p||_2^2 = p_1^2 + p_2^2 + \cdots + p_n^2.$$

Using this as a measure of uniformity of the $p_i$ has an intuitive mathematical justification--it does get larger as the $p_i$ vary more--but it has no immediate statistical justification. Let's see whether we can put it on a solid footing.

To this end, notice that the average value of the $p_i$ is $\bar p = 1/n$ (because they sum to unity and there are $n$ of them). Uniformity doesn't really refer to the actual values of the $p_i$: it refers to how they vary around their expected value. Let us therefore compute that variation and try to relate it to the $L_2$ norm. A well-known algebraic result (easily proven) is

$$||p||_2^2 = \sum_i \left(p_i - \frac{1}{n}\right)^2 + \frac{1}{n}.$$

Now the number of observations $f$ must play a critical role, for without that information we have no good idea how variable the observed frequencies ought to be. It is natural to introduce a factor of $f^2$ in order to clear the denominators in the $p_i = f_i/f$:

$$f^2||p||_2^2 = \sum_i \left(f p_i - \frac{f}{n}\right)^2 + \frac{f^2}{n} = \sum_i \left(f_i - \frac{f}{n}\right)^2 + \frac{f^2}{n}.\tag{1}$$

This is immediately recognizable as almost equal to the chi-squared statistic for a test of uniformity: the expected frequencies ($E_i$) are $f/n$ while the observed frequencies ($O_i$) are $f_i$. This statistic, by definition, is the sum of standardized differences,

$$\chi^2 = \sum_i \frac{(O_i - E_i)^2}{E_i} = \sum_i \frac{(f_i - f/n)^2}{f/n}.$$

Let us therefore divide $(1)$ by $f/n$ to introduce $\chi^2$:

$$n f ||p||_2^2 = \sum_i \frac{(f_i - f/n)^2}{f/n} + f = \chi^2 + f.$$

Finally we may isolate a statistically meaningful expression:

$$f\left(n||p||_2^2 - 1\right) = \chi^2.$$

This shows that up to an affine transformation determined by the number of categories $n$ and total number of observations $f$, the square of the $L_2$ norm of the relative frequency vector is a standard statistic used to measure uniformity of a frequency distribution. That's why the $L_2$ norm may be of value.

But why not just use the $\chi^2$ statistic in the first place?

$\endgroup$
4
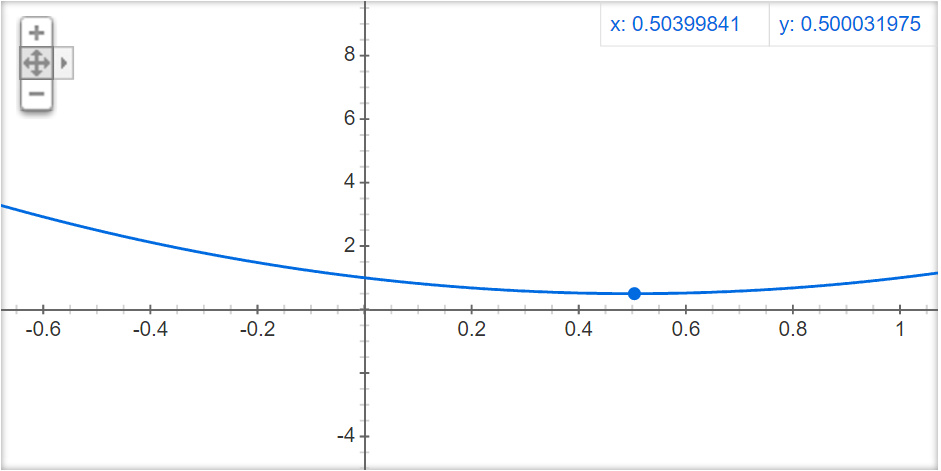
  • $\begingroup$ Using the chi-squared statistic is definitely more theoretically current, but I've found that in practical application, the norm heuristic works relatively better without scaling, and feels to be more performant. Moreover, the fact that it innately has this convex shape and a global minimum at 0.5 for all variable coordinates, is in itself a valid and relevant property to leverage, independent of the fact that it's similar to the chi-squared statistic. $\endgroup$
    – Ketan
    Commented Dec 2, 2016 at 7:37
  • $\begingroup$ Ketan, (1) The chi-squared statistic has a global minimum at 0, which is more natural than 1/2. (2) Because the chi-squared statistic can be directly related to a formal hypothesis test of uniformity, it is far more useful and informative than the $L_2$ norm. (3) None of the properties you have yet identified for the $L_2$ norm distinguish it from any other $L_p$ norm for $p\gt 1$ (or from many other mathematical functions one might devise, for that matter). (4) The chi-squared statistic properly accounts for sample size, which the $L_2$ norm does not. $\endgroup$
    – whuber
    Commented Dec 2, 2016 at 16:05
  • $\begingroup$ Agree, Chi-squared being the formal way is undoubtedly the most reliable, but like I've said, in practical applications the slightly lower variation in values using this heuristic (without scaling) has been useful, at least in my particular application. $\endgroup$
    – Ketan
    Commented Dec 3, 2016 at 12:02
  • $\begingroup$ @Whuber I'm not sure if that's always the case. In statistics, the Chi-Square distribution is most important but according to this post the LP norms still have importance. $\endgroup$
    – Arbuja
    Commented Oct 7, 2021 at 11:28
1
$\begingroup$

Why this method works ? Lets say $x+y = 1$; $(x+y)^2 = 1$; $\texttt{norm}^2 + 2xy = 1$; $xy$ is maximum when $x=y$ (uniform) and thus norm must be lower. Thus, lower norm means more uniformity. You can extend the same to vectors of length more than 2.

However, the idea of scaling using $d$ is simply a heuristic. You might want to omit that.

Over to your next question. You can use multiple methods to solve this problem. Few of the measures are:

  1. KL divergence from a uniform distribution.
  2. Dot product of the vector converted to a unit vector with a uniformly distributed unit vector of same length.
  3. Variance
$\endgroup$
1
  • $\begingroup$ This is a nice and simple mathematical observation. Thanks. $\endgroup$
    – Ketan
    Commented Dec 1, 2016 at 9:27
1
$\begingroup$

@whuber's answer is the most generalized and elaborate as usual. At the same time, @Aveek's simple mathematical observation also makes things pretty intuitive. I'd like to extend his observation a bit.

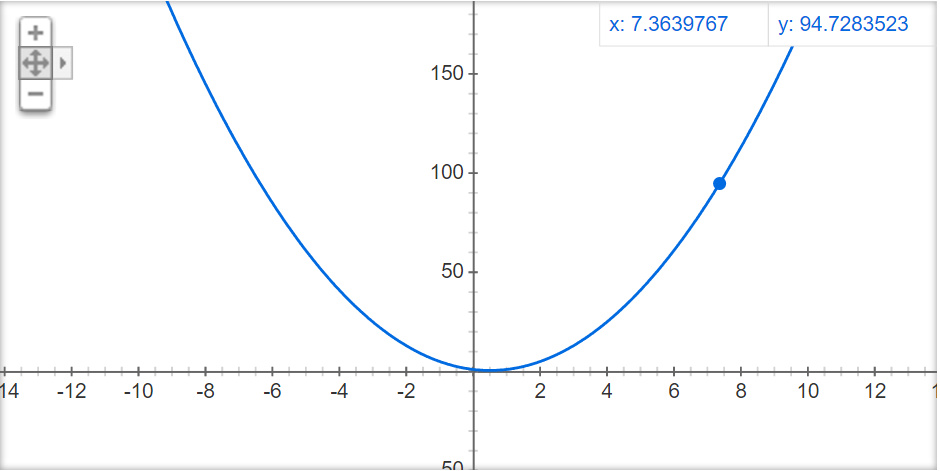
As noted, $$norm^2 + 2xy = 1$$ Therefore, $$norm^2 = 1 - 2xy$$ $$norm^2 = 1 - 2x(1-x) $$ $$norm^2 = 1 - 2x + 2x^2 $$ Hence we can denote the $norm^2$ function as: $$f = 2x^2 - 2x + 1$$ enter image description here We find the minimum of $f$ by taking its derivative and equating it to $0$, i.e. $$4x - 2 = 0$$which gives us: $$x = 0.5$$ which is $1/n$ at $n = 2$, i.e. uniform distribution. Hence we note that the minimum of the $(L_2)^2$ function (in $R^2$ in this case) is $0.5$.

enter image description here

$\endgroup$

Your Answer

By clicking “Post Your Answer”, you agree to our terms of service and acknowledge you have read our privacy policy.

Not the answer you're looking for? Browse other questions tagged or ask your own question.