4
$\begingroup$

I am trying to figure out why I keep finding better results using stepwise regression than with LASSO while there are hundreds of posts and papers stating the opposite.

To explain a bit better : I got a pool of 20 variables I want to select from and about 150 other variables I am enforcing in the model. (It is in an association study context, the 20 selectable variables being genetic markers and the rest being PCA components allowing control of the kinship between individuals.)

The 20 variables are quite correlated as shown below : Correlation plot
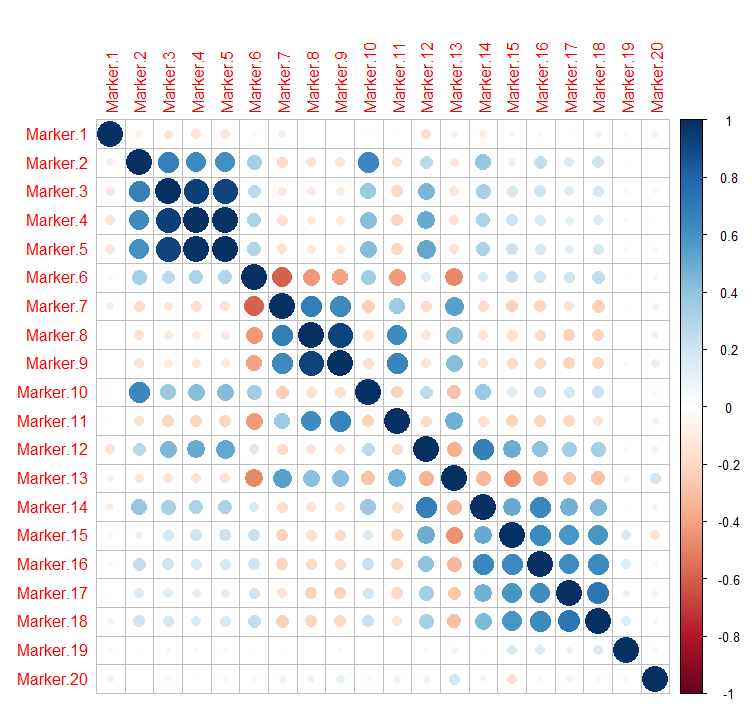
I am trying to get a subset of the markers that still explains the response variable in a 'good enough' manner. For that I used two methods a forward/backward regression and a LASSO regression.

I am a bit puzzled by the results :

$\begin{array}{r|c|c} & Stepwise & LASSO \\ \hline Number\ of\ variables\ selected & 10 & 15 \\ Correlation\ fitted\ vs.\ observed\ values & 0.849 & 0.846 \\ MSE & 323 & 330 \end{array}$

I was not expecting LASSO to absolutely select less variables than the stepwise algorithm but I did expect that the end results would be better. How can I explain those ? Are the criterion I am using not appropriate or is it because I am using fitted values and not predicted values of additional data, or is it a totally different matter ?

Note that I used the shrinked model to get the fitted values so it is not the same problem as here

$\endgroup$
5
  • 3
    $\begingroup$ Your table represents how well you fit your present data set. Have you run any tests related to the generalizability of your model to other samples, like repeating your procedures on multiple bootstrap resamples? That's where the superiority of LASSO is more likely to be seen. Please try that and add those results to your question. $\endgroup$
    – EdM
    Commented Dec 7, 2016 at 10:57
  • $\begingroup$ The MSE and correlation were estimated via a 5-folds CV, sorry if I was not clear. $\endgroup$
    – Riff
    Commented Dec 7, 2016 at 11:56
  • $\begingroup$ Agree with EdM, to get a fair performance evaluation you need to test your model on new data that was not used for selecting and/or fitting the model. $\endgroup$ Commented Dec 7, 2016 at 12:08
  • $\begingroup$ A single 5-fold CV using your single set of model parameters is not enough. You need to do many CVs or, perhaps better, multiple bootstrap resamples of your data. Then repeat the entire model building process, including the variable selection steps, on each resample and see how well the model built on the resample fit your original data set. Do this hundreds of times, and combine the results. $\endgroup$
    – EdM
    Commented Dec 7, 2016 at 13:17
  • $\begingroup$ I don't understand how multiple CV would lead to different results. The dataset is very small (~250 individuals) and I can't totally randomize the folds as there are relationship between individuals that needs to be preserved in each fold so that means very few different possible fold. As for bootstrap, I will try but it may prove difficult because of the relatedness problem. $\endgroup$
    – Riff
    Commented Dec 7, 2016 at 13:22

2 Answers 2

3
$\begingroup$

The problem here is much larger than your choice of LASSO or stepwise regression. With only 250 cases there is no way to evaluate "a pool of 20 variables I want to select from and about 150 other variables I am enforcing in the model" (emphasis added) unless you do some type of penalization. You are almost certainly severely over-fit with the 150 enforced variables, as the extremely high correlation coefficients (at least based on my decades of experience in biologic research) suggest. Your entire model should probably only include on the order of 20 effective predictors, either 20 unpenalized predictors or a larger number that are penalized. If you insist on keeping all those 150 enforced predictors in the model then you should use ridge regression to penalize them.

The difficulty of drawing reliable conclusions from small data sets relative to the number of predictor variables is precisely why it's important to evaluate model-building approaches with tools like multiple bootstraps. Your present sample is the best estimate you have of the underlying population. Taking multiple samples of the same size from the data with replacement and repeating the entire model building process on each of hundreds of resamples is a useful way to estimate whether you would have similar success with other data samples of the same size. Any rare relationships among individuals are those most likely to be missed in a new sample from the population and thus likely to pose problems with generalization. The advantage of LASSO over stepwise selection is seen in these tests of whether the modeling process generalizes well to new samples.

$\endgroup$
2
  • $\begingroup$ Thanks for the answer. Since you seem to be familiar with biologic data, I have a follow-up : would you then recommend using less PCA components of the kinship matrix or is essential to get as much of the initial inertia as possible ? (my problem is that I usually model relatedness modelling it as a random effect in a mixed model as $\mathcal{N}(0, \sigma^2K$) so I am not familiar with using principal components as fixed effects) $\endgroup$
    – Riff
    Commented Dec 7, 2016 at 16:12
  • $\begingroup$ Ridge regression is essentially a weighted principal-components regression, rather than the all-or-none selection in standard principal-components regression. See ESLII, pages 79-80. I don't have experience with PCA of kinship matrices, but I suspect that with ridge you could use the (appropriately standardized for PCA) full kinship matrix itself. The ridge penalty (chosen, say, by cross-validation) then would heavily discount the PCs that provide the least useful information, avoiding over-fitting even if all PCs are formally in the model. $\endgroup$
    – EdM
    Commented Dec 7, 2016 at 18:32
2
$\begingroup$

That difference hardly seems significant. Try recalculating MSE on several subsets of the data and see if stepwise regression consistently outperforms lasso. Also, what are your hyperparameters and did you do gridsearch?

$\endgroup$
1
  • 1
    $\begingroup$ I agree it is not different, and that is what is puzzling me : I could get the same results for 5 less markers to genotype (which is a big deal when you have thousands of those types of results). For LASSO : The lambda parameter was determined using CV (used value is 0.055). For stepwise the entry & stay levels were 0.01. The MSE was estimated based on CV results for both. $\endgroup$
    – Riff
    Commented Dec 7, 2016 at 11:51

Your Answer

By clicking “Post Your Answer”, you agree to our terms of service and acknowledge you have read our privacy policy.

Not the answer you're looking for? Browse other questions tagged or ask your own question.