3
$\begingroup$

I am trying to solve a problem of dimentionality reduction on a Matrix of predictors X(136x481). I found that PCA does not a good job in my case because it create components that explain just the variance of the Matrix X without taking into consideration Y. Considering that the final goal is to estimate the rolling coefficients to explain the changes in Y, I though that maybe PLS Regression as a preliminary step whould have worked way better than PCA.

Therefore I run the PLS regression and I obtained 126 components that explain 96% of the variance. Now considering that not all of them are significant, I was thinking to run a rolling stepwise selction that captures which of the previously estimated components are significant within each regression window in order to get a new Matrix of predictors that I will use to estimate the coefficients in a rolling fashion.

Does the above procedure make any sense? Am I missing something?

Thank you for your help.


I will explain you now better the rationale behind these procedure. Basically, the vector of Y is a vertor of return generated by n-factors(the columns of X). I do not know, however, which are the factors that capture the return on each period (136 monthly returns). Therefore, I decided that to be sure to include a Comprehensive pool of factors for the Whole time series, the best approach would have been to include the largest number of factors available. Now, the returns on the vector Y comes from exposures (columns of X) that change very often through time, which means that at each period, one factor that previously contributed now may not contribute. The first problem generated by this approach is therefore that I need to find a way to select the relevant variables in a rolling framework( that is, within each regression window) in a way that are both statistically significant and not correlated to a level that creates multicollinearity problems.

Summing up, I have to create a new Matrix X that contains a smaller number of factors but that are highly significant for the Y and at the same time not correlated. After that I have to run a rolling OLS to estimate the coefficients of this new Matrix, to estimate the rolling exposures (betas) on these components but this is behind the scope of the question.

Coming back to the problem, I thought to use PLS regression as you said just to obtain the scores to be used in the stepwise. The rolling stepwise regression I performed after basically select within each regression window the scores that are significant (pval<=.05 ) for the Y values every time the window slides. I did this process mainly because the Scores obtained from PLS are combinations of the original variables which as I said, may be significant in one period but not significant in another. Could you please explain me why this selection process based on adding/dropping the scores of PLS would not yield good results?

edit I now understand that basically once you set up the problem od dimentionality reduction with PC you have to use all of them. But if I wantto accomplish both dimentionality reduction and statistic significance in a rolling fashion how can I do it behind the stepwise procedure? I am asking this because stepwise still generates matrix of predictors that are significant but highly correlated

$\endgroup$
4
  • $\begingroup$ What is your ultimate goal? Are you trying to build a predictive model using PLS? Or you just want dimension reduction which is then to be used in some other procedure? $\endgroup$
    – gunakkoc
    Commented Aug 4, 2017 at 10:33
  • $\begingroup$ Or are you trying to find optimal number of components for PLS regression? $\endgroup$
    – gunakkoc
    Commented Aug 4, 2017 at 10:35
  • 1
    $\begingroup$ Usually the answer is that stepwise regression does not make sense. I see no particular reason why it would in this case. $\endgroup$
    – Björn
    Commented Aug 4, 2017 at 10:42
  • $\begingroup$ I personally agree with you, but I did want to avoid such an answer because there might be cases where it is somehow useful and which I am not aware of yet. $\endgroup$
    – gunakkoc
    Commented Aug 4, 2017 at 10:58

1 Answer 1

2
$\begingroup$

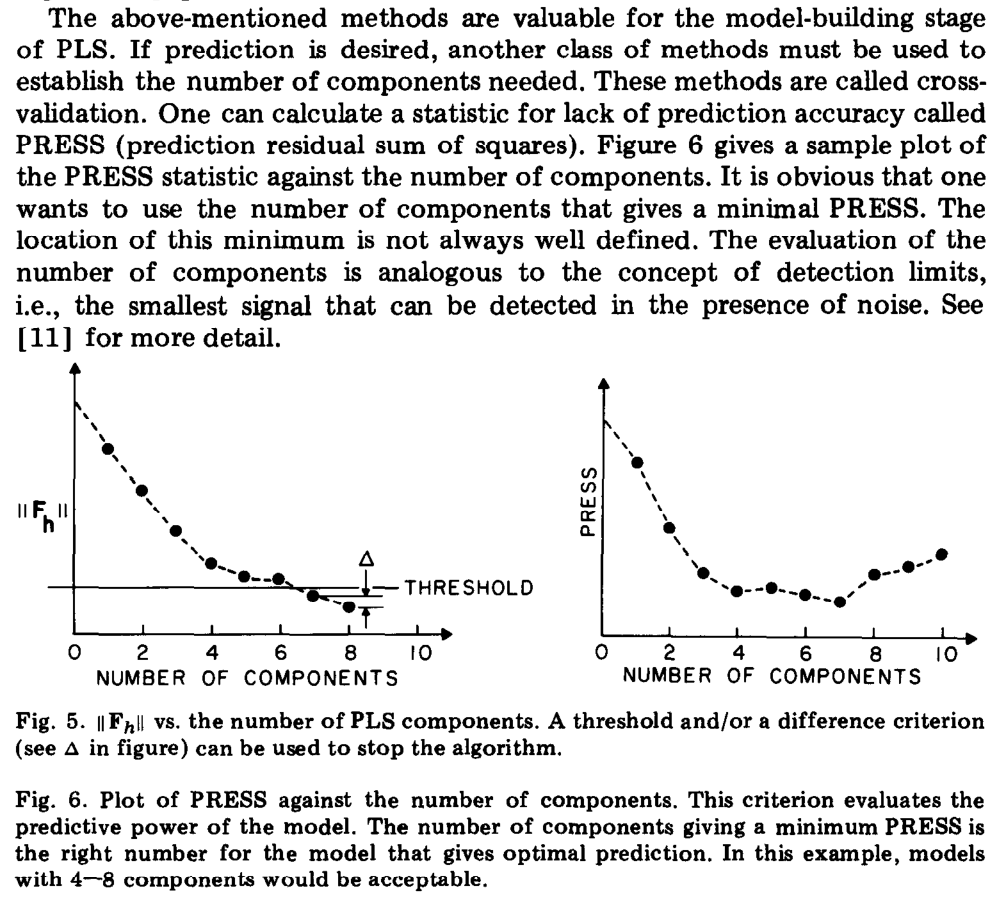
Firstly, unlike PCA, "the sum of variances of all PLS components is normally less than 100%".(a good explanation by @amoeba) Also, since the aim of PLS models is usually to build a predictive model, instead of explained variance based decisions, using predicted residual error sum of square(PRESS) values obtained by cross-validation is probably the most common practice while selecting number of components. It is basically a plot of number of components vs. PRESS values where one usually chooses number of components corresponding to the first minima. Read more about it here.

If you are only interested in dimension reduction ability of PLS, then you are interested in using the X scores of PLS obtained by, say, first h number of components. If, for some reason, you want to use these scores as an input to another regression method, I suggest you to cross-validate the entire modeling steps.

There is also a way of using PCA for regression which is called Principle Components Regression (PCR) in which the obtained scores are used as X matrix for the following OLS with same Y. However, I have never seen it performing better than PLSR. Furthermore, there is this article by the author of famous SIMPLS algorithm of PLS, namely PLS fits closer than PCR.

Finally, on your main question, if what you meant by step-wise regression for "which components to use" rather than "how many first h components to use", I do not see any reason to use that approach. The first h component approach is almost always better.

Edit: Honestly, I don't know much about rolling regression and time series. However, the reason to choose first h number of components should apply to all cases and is about the theory of PLS. Basically, the first component is the direction for X that maximizes the covariance with Y that follows a set of rules such as the orthogonality of weights which are used to obtain X scores. The calculation of next components is then accomplished by removing covariance that are covered by previous components and finding a new direction that aims to cover remaining covariance as much as possible while obeying the same certain criterions. Selecting, for example, 1st and 3rd components and leaving the 2nd out would be like skipping the 2nd digit while simply multiplying two 3 digit numbers. It is arguable that "digit" may not come out useful, but it is wise to keep it.

Edit2: to @Frank Harrell , I totally disagree with you. See the quotation directly from the article: Geladi, Paul, and Bruce R. Kowalski. "Partial least-squares regression: a tutorial." Analytica chimica acta 185 (1986): 1-17.

Geladi, Paul, and Bruce R. Kowalski. "Partial least-squares regression: a tutorial." Analytica chimica acta 185 (1986): 1-17.

There are certain cases, i.e. when there is no local minima, selecting many number of components may lead to modeling of noise thus overfitting. However, since one can not choose number of components arbitrarily or one can not include all components, (because doing so makes PLS equivalent to OLS) CV for number of components is the way to go. PLS utilizing Y matrix makes no exception to that. Ridge, LASSO, PLSR, PCR all needs CV for selecting alpha, lambda and alpha, number of latent variables and principle components, respectively.

$\endgroup$
8
  • $\begingroup$ If PLS is supervised learning, the procedure you've outlined would result in overfitting unlike PC regression. $\endgroup$ Commented Aug 4, 2017 at 11:49
  • $\begingroup$ It is supervised learning. Which procedure are you pointing at? The one in the second paragraph? $\endgroup$
    – gunakkoc
    Commented Aug 4, 2017 at 11:52
  • $\begingroup$ Any method used to screen predictors that is utilizing $Y$, including PLS. $\endgroup$ Commented Aug 4, 2017 at 12:31
  • $\begingroup$ It is not the predictors but the components that are "screened". As in PCA where one penalizes directions of low variance, in PLS the penalization is also on directions. The only different thing is that these directions are obtained from maximization problem of $max(cov(X,Y))$ in PLS. So the PLS scores are also linear combinations of original predictors. Moreover, PLS, PCR, Ridge, LASSO etc. all utilizes $Y$ and all needs parameter optimizations. Using CV is a convenient way for these parameter optimizations, at least for the regularization based methods that I have mentioned. $\endgroup$
    – gunakkoc
    Commented Aug 4, 2017 at 12:46
  • $\begingroup$ Thank you for your answer. The procedure I am pointing at is the one in the second paragraph. See the edited question for the rationale behind the procedure.. $\endgroup$
    – Federico
    Commented Aug 4, 2017 at 12:54

Your Answer

By clicking “Post Your Answer”, you agree to our terms of service and acknowledge you have read our privacy policy.

Not the answer you're looking for? Browse other questions tagged or ask your own question.