0
$\begingroup$

Problem: I have to generate in R a synthetic dataset which contains three different variables that didn't follow any known distribution.

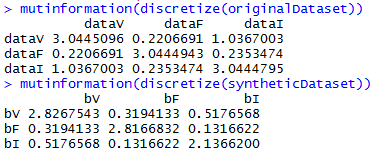
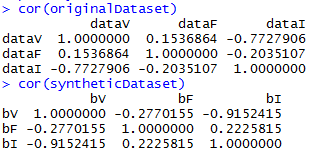
What I did until now: Grouping historical values of each distributions in Markov chains, I was able to generate synthetical data that are quite good for my purpose if I evaluate each distribution separately. However, if I try to compare the whole synthetic dataset correlation matrix or the mutual information with the real dataset ones, the results are really poor:

Correlation Matrix

For the mutual information:

Mutual Information

I already tried the Cholesky decomposition but the results were far (and even worse) from what I was able to achieve with the first version of the model. I also tried "to mix" the Markov Chains in order to select the next state of all the other distributions using the current state of one of them, but also in that case the results were not good enough.

Question: are there any strategies/statistical tools/models to solve this problem?

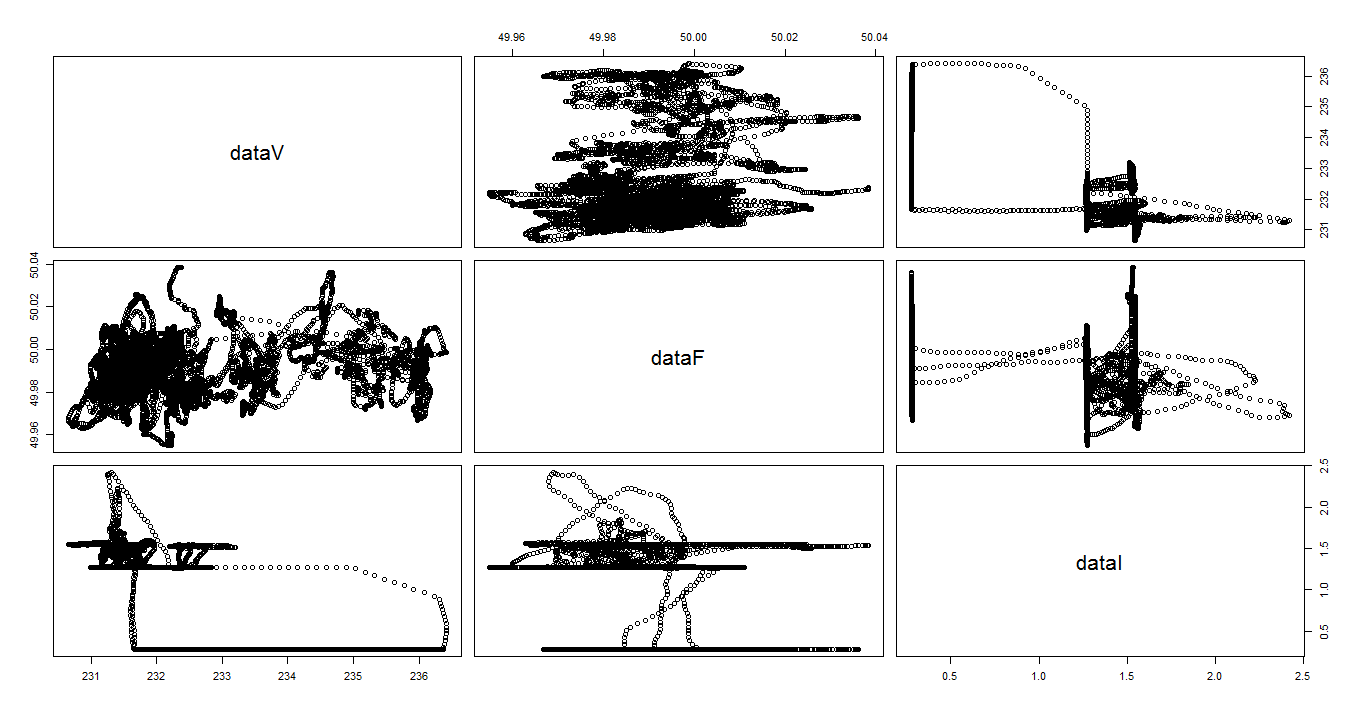
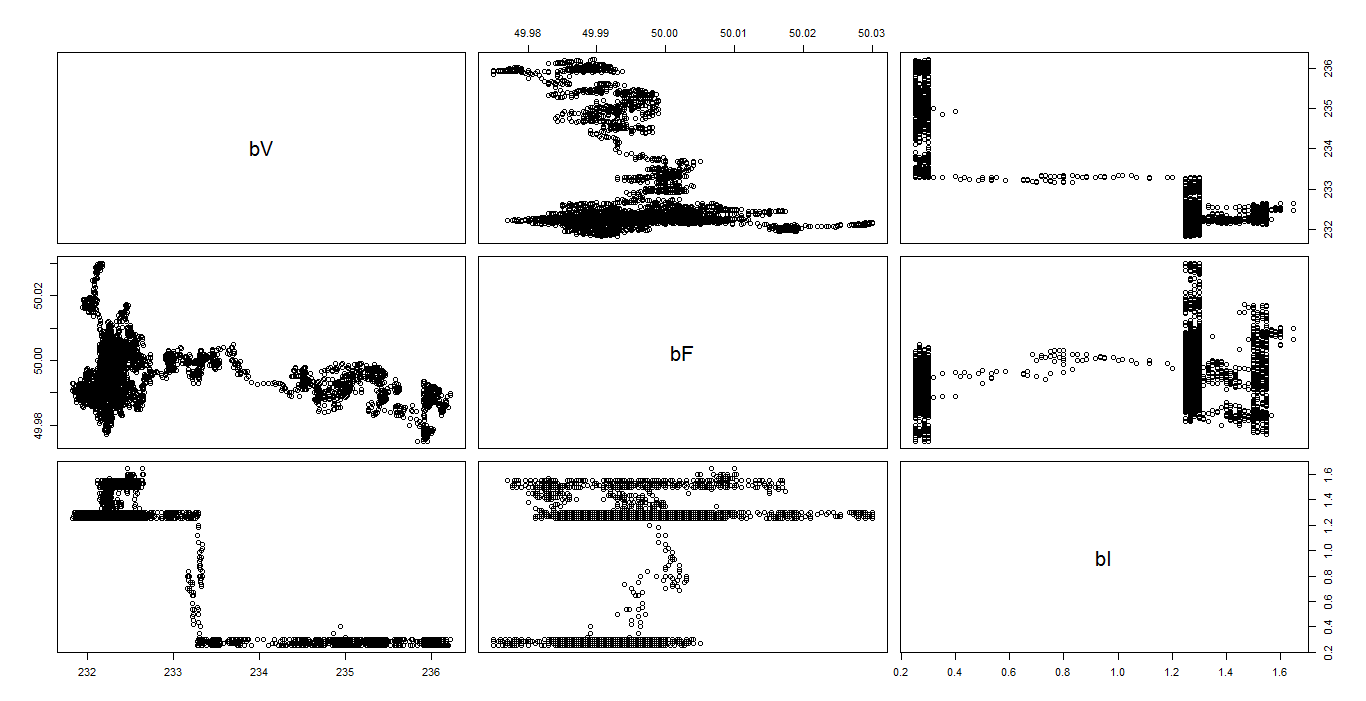
To graphically understand the state of my results, these are the plots of the original dataset (first figure) and of the synthetic one (second figure).

Original Dataset

Synthetic Dataset

$\endgroup$
2
  • 2
    $\begingroup$ Please explain the purpose of this exercise. That will help suggest appropriate solutions (from among the myriad possible ones). Why are you generating synthetic data? $\endgroup$
    – whuber
    Commented Feb 3, 2017 at 17:59
  • $\begingroup$ This is an exercise that I have to solve: my objective is to generate synthetic data from three different time series related with a fixed covariance / mutual information. The main problem is that these time series don't follow any kind of known distribution because they're related to machine-behaviour and, for the same reason, the values show a time consistency that keeps me from simply using rnorm or similar. $\endgroup$
    – Francesco
    Commented Feb 14, 2017 at 13:13

2 Answers 2

1
$\begingroup$

I'm not totally sure what you try to achieve here. I also don't understand your notion of 'non-random' there. But I assume that you're trying to simulate a data of three variable that has the same joint distribution as some real data set, and you specifically want the correlation structure to be the same.

There are many ways to achieve this. If you have plenty of data (~100^3), you can do non-parametric density estimation to recover the joint density and do Monte-Carlo with the estimated density.

Another way is to restrict our attention to marginals and correlation, which would presumably work well with much less data. It would work as follows.

  1. First estimate the marginal distribution of each variable.
  2. Apply the corresponding quantile functions(the inverse of the distribution functions) to each variable. Denote them by $Q_x,Q_y,Q_z$.
  3. Estimate the correlation matrix $\Sigma$ of $\Phi^{-1}(Q_x),\Phi^{-1}(Q_y),\Phi^{-1}(Q_z)$, where $\Phi$ is the distribution function of standard normal.
  4. Now, we're ready to simulate data using Gaussian copula.
  5. Generate a normal vector that follows $N(0,\Sigma)$. You can do it by multiplying Cholesky decomposition of $\Sigma$ to the independent normal vector. Denote them by $x_{sim},y_{sim},z_{sim}$.
  6. Let $X_{sim}=Q_x^{-1}(\Phi(x_{sim}))$, and define $Y_{sim},Z_{sim}$ similarly. Then these are desired random variables that have the marginal distributions estimated in 1, and similar correlation structure as the original data.
$\endgroup$
1
  • $\begingroup$ I want to generate three synthetic distributions which correspond to three different physical quantities (eg: voltage, current and frequency) starting from real world data. I don't want to simply generate some data because these data needs to have also a time consistency since, for example, if the voltage in t1 is 123, in t2 it can't be 400 or -20 but a value between 124 and 128. However, since the distributions are not known, I wasn't able to find a way to extract / estimate the marginal distribution. $\endgroup$
    – Francesco
    Commented Feb 14, 2017 at 13:08
0
$\begingroup$

I'm not exactly sure I understand what you're trying to do, but if your goal is simply to "Generate non-random data that follows a given correlation matrix," the approach you're taking appears more complicated than necessary. Consider the following.

Let $x \sim F$ be an $n$-dimensional real random vector with mean $\mu$ and positive-definite covariance $\Sigma$. Let $X\in\mathbb{R}^{m\times n}$ where each row is a draw from $F$. To impose a correlation matrix $\Omega \in \mathbb{R}^{n\times n}$ (i.e. make it so your data has correlation $\Omega$) while preserving the variances $\mathbf{diag}\Sigma$ and mean $\mu$, the following transformation may be applied to $X$:

$$\phi(X) = (X - \mathbf{1}\otimes \mu)\cdot\Sigma^{-1/2}\cdot\Omega^{1/2}\cdot\mathbf{diag}\Sigma^{1/2} + \mathbf{1}\otimes \mu$$

where $\mathbf{1}$ is an $n$-vector with $1$ in every entry and $\otimes$ is the standard outer-product. Then, the rows of $\phi(X)\in\mathbb{R}^{m\times n}$ have correlation $\Omega$, variances $\mathbf{diag}\Sigma$, and mean $\mu$. In your case, if you don't really have a preference for the mean and variance, just set $(\mu, \Sigma) = (0, \mathbb{I})$.

$\endgroup$

Your Answer

By clicking “Post Your Answer”, you agree to our terms of service and acknowledge you have read our privacy policy.

Not the answer you're looking for? Browse other questions tagged or ask your own question.