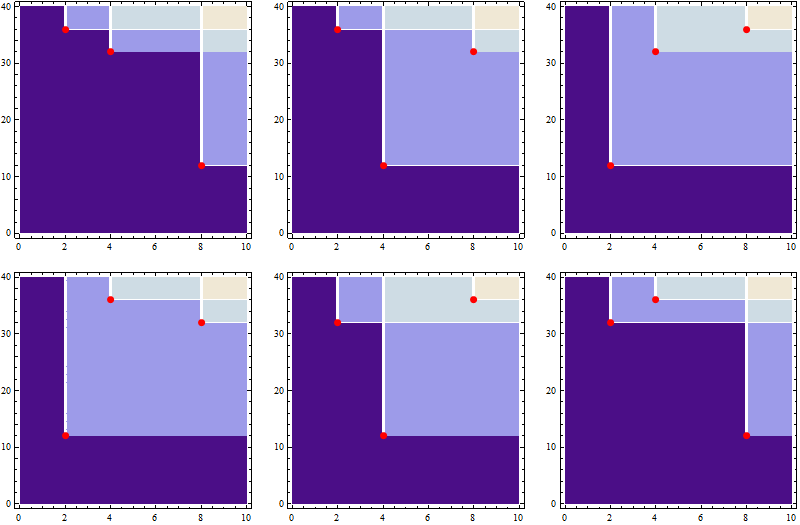
By definition, the ECDF $F$ at any location $(x,y)$ counts the data points that lie to the left and beneath $(x,y)$. Specifically, writing $(x_i,y_i), i=1, 2, \ldots, n$ for the data points (which may include duplicates),
$$F(x,y) = \frac{1}{n}\times \#\{(x_i, y_i)\mid x_i \le x, \ y_i \le y\}.\tag{1}$$
Equivalently, each data point $(x_i,y_i)$ contributes $1/n$ towards the count at all points lying above it and to its right. Such points form a bi-infinite rectangle in the plane with its lower left corner at $(x_i,y_i)$. Imagine, then, overlaying $n$ such translucent rectangles: the number overlaid at any point $(x,y)$ is the count in $(1)$.
This is better illustrated by showing various configurations of points in the plane, rather than a single configuration. I therefore took all three $x$ values $2,4,8$ and all three $y$ values $12, 32, 36$ and re-matched them using all six possible permutations to produce six datasets. They show all six possible qualitative configurations of the ECDF. Here they are as contour plots, with the data points overlaid in red. The panel at the upper left depicts the data given in the question.

The colors graduate from darkest (for a value of $0$) in discrete steps of $1/n=1/3$ up to lightest (a value of $1$). Think of the bi-infinite rectangles as being light blue: where two of them overlap they look light green and where all three overlap they are gold.
These descriptions extend to more than two dimensions (and down to one dimension) with the obvious modifications in the numbers of indexes.

