1
$\begingroup$

I am predicting a user behavior at any hour of a day given the behavior before two hours. For instance, given the behavior intensity at 9am and 10am, I want to predict the behavior intensity at 11am.

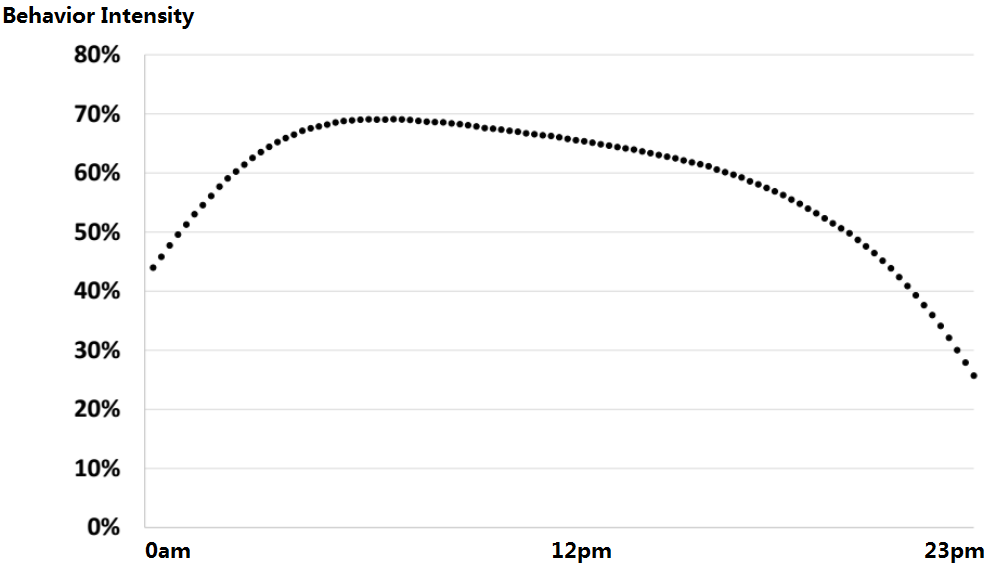
The dataset contains daily behavior intensity of different users. For one single user, the days are not continuous. Thus, each day can be considered as an independent time series.

I find that the average behavior intensity of a day is like a concave curve. That is, the behavior intensity is low at night and early morning. It becomes high during the day.

enter image description here

My questions:

1) Is it stationary or non-stationary?

2) For non-stationary time series, the prediction outcome is dependent to the time stamp. In this case, to deal with non-stationary, instead of using ARIMA, can I use multi-order autoregressive model and add time stamp as one feature? (because in my case, time stamp are limited, i.e, 24 hours)

enter image description here

Or even feature interactions?

enter image description here

3) If the answer to the second question is NO. When building ARIMA, what kind of differencing method I can try for my data?

$\endgroup$
1
  • $\begingroup$ just curious what is the "intensity" measure ? I am used to time series defined in real numbers, but not in percentages. maybe using different measure would be an option ? $\endgroup$ Commented Feb 28, 2017 at 9:13

1 Answer 1

0
$\begingroup$

As a first step I would ask myself whether the series looks mean-reverting. Since the series has a specific "inverted U" shape, it does not seem to be mean-reverting. Therefore I suggest it is not stationary.

However there is chance that your series could be trend-stationary. If you are able to find any function f(t) of time t that describes the trend of "inverted U", you can remove the trend and what remains could (maybe) be stationary.

One shape of such deterministic function f(t) is a linear trend that you have written in your first formula. However this is not an option for you, because clearly the trend is not linear but "inverted U" shape.

You could try to capture the deterministic trend by another f(t) function, for example a quadratic form (instead of linear), but the assumption of a quadratic trend in the generating process appears "too artificial" to me (i.e. there is no rational expectation for the variable "intensity" to be a quadratic time process)

If you are able to find such f(t) that you can fit into your regression formula and you will obtain stationary residuals, then it is a win for you, because you can apply such model (although I have also seen doubts about this approach on a theoretical level)

If you are not able to find such f(t) that would lead to stationary residuals in your regression formula, then the time series is indeed non stationary. In that case you must apply differencing (of order 1 or possibly 2) on your time series.

However, your series is pretty short (few observations). To build a robust model, you would do better to connect all days together into one series. Such series will have strong seasonality (morning/evening/noon) and you would be able to employ some seasonal time series model. Because indeed the "inverted U" shape appears to be a seasonal pattern and nothing else.

$\endgroup$
1
  • $\begingroup$ @Munichong and K.S.H., differencing is only appropriate when a time series is integrated. Differencing is not a panacea as it introduces integrated moving-average residuals if the original series is not integrated. $\endgroup$ Commented Mar 4, 2017 at 15:12

Your Answer

By clicking “Post Your Answer”, you agree to our terms of service and acknowledge you have read our privacy policy.

Not the answer you're looking for? Browse other questions tagged or ask your own question.