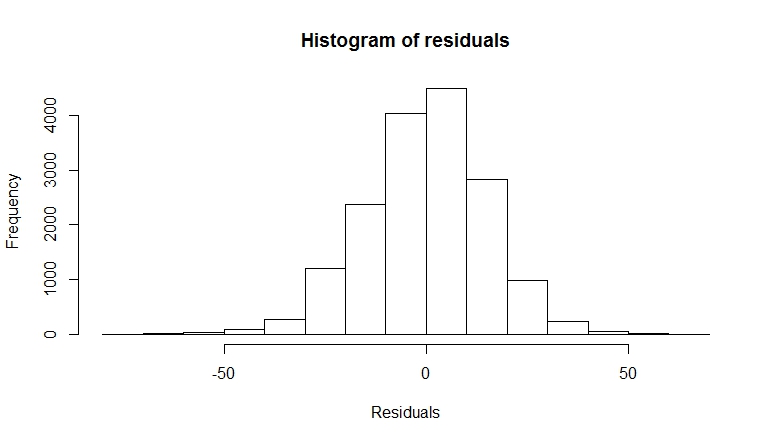
David Lane's comment is very thoughtful, and you should consider that. As well as affecting your p-values, your huge sample size will cause Levene's test to always fail, as samples that size will never have the same variance. So you basically have three options
Decide whether the variance inequality is sufficiently large to severely impact your two-way ANOVA.
Transform your data
Use an alternative test.
Option 1 is the easier one to resolve. It would be helpful if we could see some graphs that show the variance of each group. Simply by eyeballing it, it is the variance difference quite extreme? Or fairly similar? All sorts of rules of thumb are thrown around, but many people seem to power ahead when the largest variance is no more than three times the smallest variance. So try looking at your data this way, rather than relying on the statistical test.
Option 2 may work. There are a variety of transformations that may stabilise your variance (Box-cox, square root, log, etc.). Whether this stabilisation comes at the cost of your normality is another question.
Also of note is that transformations typically make the interpretation of your data much more difficult. You would need to carefully think about the transformation that you're applying, and how it is going to affect your interpretation.
Finally, option 3. There are several procedures for dealing with heteroescasdicity. You might want to look at robust regression, using rlm in the MASS package. There might also be non-parametric options such as adonis in the vegan package (although I'm not sure if that will deal with unequal variance).
Finally, you could use a process that explicitly models the variances, rather than making assumptions about them. I would recommend looking at gls in the nlme package as well as this answer.
Explicitly modelling unequal variances in a linear model to get better conf/pred intervals?
Hope some of this will help solve your problem.


