I've been tasked with developing regression and classification models for time series data. For each observation I have a continuous target for regression and a discrete target for classification.
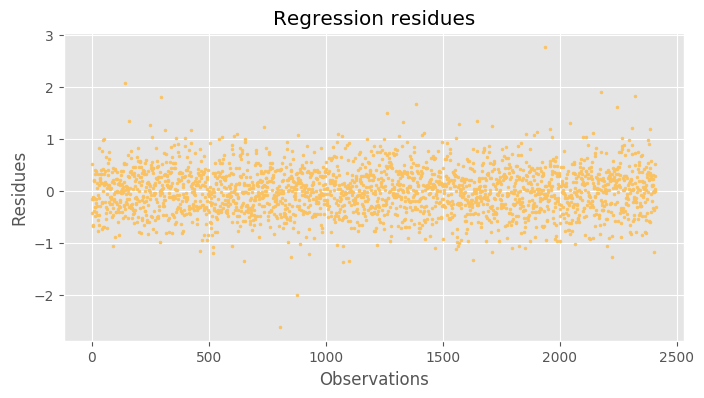
I've fitted a LASSO model which works stupendously well. It has very low MAE and RMSE values, as well as low relative errors (in the order of 0.4%). R^2 is 0.99 but I never trust it too much. Residues are very regular and appear to follow a normal distribution with zero mean and 1/2 variance:
Finally, there's virtually no autocorrelation between residues for any meaningful lag value.
On the other hand, the classification task seems impossible. There are three classes which are almost perfectly distributed in the dataset, but they appear to have been chosen at random. I ran PCA to reduce the data to two components in order to plot it, and I just observed a garbled mess of colored points with no visible pattern.
My distinct impression is that the dataset is contrived and does not represent real observations. Are there techniques to determine statistically how likely is such a thing?
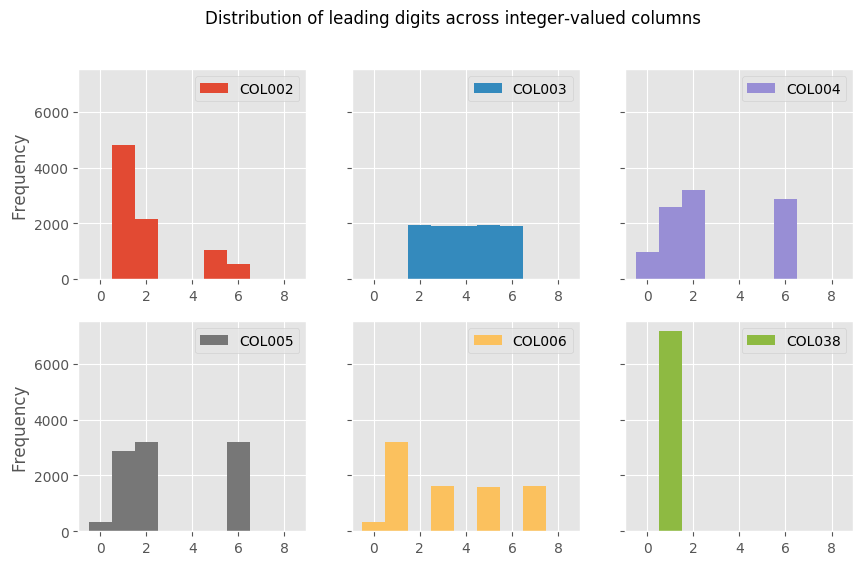
I know about Benford's law, but I'm not sure if it applies to real values as well as integers. Out of curiosity, I computed the frequencies for the integer-valued columns in my dataset, and these are the results:
Those certainly do not seem to match Benford's law.
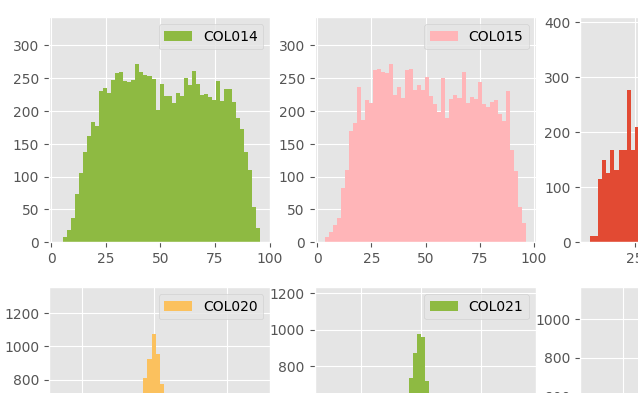
I also observed that some columns approximate very well certain distributions (e.g. I have three columns whose values approximate bimodal distributions very well).
Unfortunately, the dataset has been anonymized, and it might come from a financial context. I don't know anything else about it.
EDIT: I plotted histograms for all the columns in the dataset. Some of them really look like famous distributions. Maybe someone with more experience than me? I'm not looking for a definitive judgement here, since I know it's not possible. It's just my curiosity, in the end. Here is the result (click to see full picture with all the columns):


