32
$\begingroup$

I am writing my PhD thesis and I've realized that I rely excessively in box plots in order to compare distributions. Which other alternatives do you like for achieving this task?

I'd also like to ask if you know any other resource as the R gallery in which I can inspire myself with different ideas on data visualization.

$\endgroup$
6
  • 7
    $\begingroup$ I think the choice also depends on the features you want to compare. You might consider histograms, hist; smoothed densities, density; QQ-plots qqplot; stem-and-leaf plots (a bit ancient) stem. In addition, the Kolmogorov-Smirnov test might be a good complement ks.test. $\endgroup$
    – user10525
    Commented May 13, 2012 at 23:44
  • 1
    $\begingroup$ How about a histogram, a kernal density estimate, or a violin plot? $\endgroup$
    – Alexander
    Commented May 13, 2012 at 23:44
  • $\begingroup$ Stem and leaf plots are like histograms but with the added feature that they allow you to determine the exact value of of each observation. It contains more information about the data than you get from a boxplot or q histogram. $\endgroup$ Commented May 13, 2012 at 23:54
  • 2
    $\begingroup$ @Procrastinator, that has the makings of a good answer, if you wanted to elaborate it a little, you could convert that into answer. Pedro, you might also be interested in this, which covers initial graphical data exploration. It's not exactly what you're asking for, but might be of interest to you nonetheless. $\endgroup$ Commented May 14, 2012 at 1:38
  • 1
    $\begingroup$ Thanks guys, I am aware of those options and have used some of them already. I have certainly not explored the leaf plot. I'll have a deeper look on the link you've provided and on @Procastinator 's answer $\endgroup$ Commented May 14, 2012 at 9:24

7 Answers 7

26
$\begingroup$

I am going to elaborate my comment, as suggested by @gung. I will also include the violin plot suggested by @Alexander, for completeness. Some of these tools can be used for comparing more than two samples.

# Required packages

library(sn)
library(aplpack)
library(vioplot)
library(moments)
library(beanplot)

# Simulate from a normal and skew-normal distributions
x = rnorm(250,0,1)
y = rsn(250,0,1,5)

# Separated histograms
hist(x)
hist(y)

# Combined histograms
hist(x, xlim=c(-4,4),ylim=c(0,1), col="red",probability=T)
hist(y, add=T, col="blue",probability=T)

# Boxplots
boxplot(x,y)

# Separated smoothed densities
plot(density(x))
plot(density(y))

# Combined smoothed densities
plot(density(x),type="l",col="red",ylim=c(0,1),xlim=c(-4,4))
points(density(y),type="l",col="blue")

# Stem-and-leaf plots
stem(x)
stem(y)

# Back-to-back stem-and-leaf plots
stem.leaf.backback(x,y)

# Violin plot (suggested by Alexander)
vioplot(x,y)

# QQ-plot
qqplot(x,y,xlim=c(-4,4),ylim=c(-4,4))
qqline(x,y,col="red")

# Kolmogorov-Smirnov test
ks.test(x,y)

# six-numbers summary
summary(x)
summary(y)

# moment-based summary
c(mean(x),var(x),skewness(x),kurtosis(x))
c(mean(y),var(y),skewness(y),kurtosis(y))

# Empirical ROC curve
xx = c(-Inf, sort(unique(c(x,y))), Inf)
sens = sapply(xx, function(t){mean(x >= t)})
spec = sapply(xx, function(t){mean(y < t)})

plot(0, 0, xlim = c(0, 1), ylim = c(0, 1), type = 'l')
segments(0, 0, 1, 1, col = 1)
lines(1 - spec, sens, type = 'l', col = 2, lwd = 1)

# Beanplots
beanplot(x,y)

# Empirical CDF
plot(ecdf(x))
lines(ecdf(y))

I hope this helps.

$\endgroup$
15
$\begingroup$

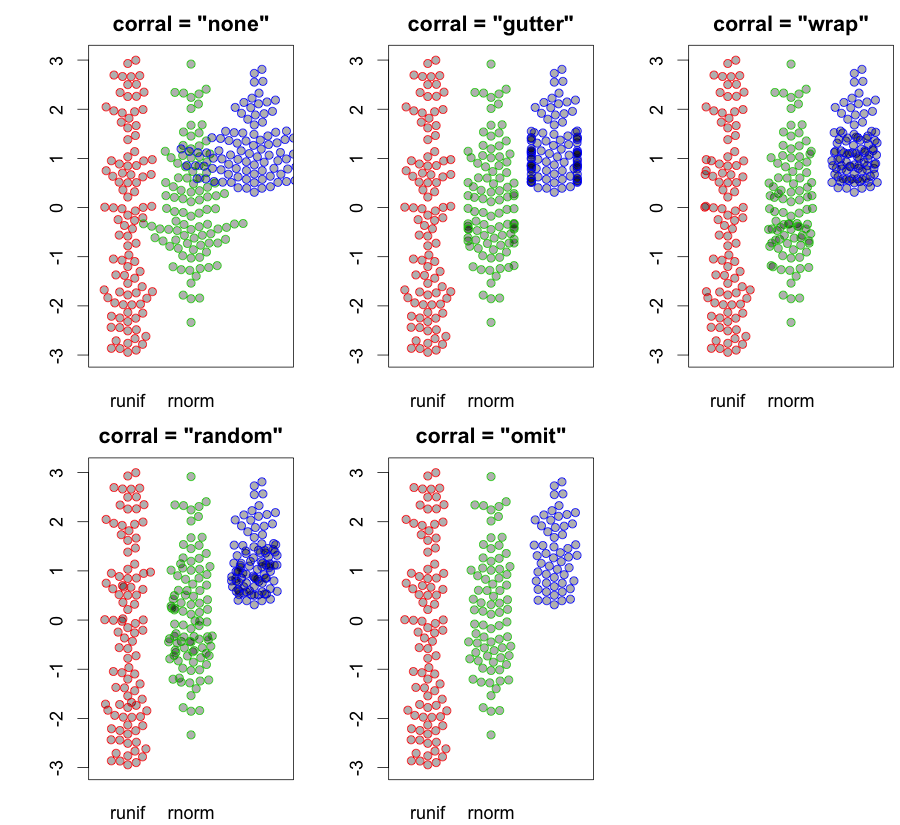
After exploring a bit more on your suggestions I found this kind of plot to complement @Procastinator 's answer. It is called 'bee swarm' and is a mixture of box plot with violin plot with the same detail level as scatter plot.

beeswarm R package

example of beeswarm plot

$\endgroup$
1
  • 2
    $\begingroup$ I have also included beanplot. $\endgroup$
    – user10525
    Commented May 16, 2012 at 14:59
8
$\begingroup$

Here's a nice tutorial from Nathan Yau's Flowing Data blog using R and US state-level crime data. It shows:

  • Box-and-Whisker Plots (which you already use)
  • Histograms
  • Kernel Density Plots
  • Rug Plots
  • Violin Plots
  • Bean Plots (a weird combo of a box plot, density plot, with a rug in the middle).

Lately, I find myself plotting CDFs much more than histograms.

$\endgroup$
2
  • 2
    $\begingroup$ +1 for kernel density plots. They're a lot less 'busy' than histograms for plotting multiple populations. $\endgroup$
    – Doresoom
    Commented Nov 6, 2012 at 14:39
  • $\begingroup$ Further, check out RainCloudPlots in the (weirdly named) PtitPrince Python or R package. They come in handy since they combine KDE, box, and swarms. Here's a nice figure from someone's blog. I used them in this 2021 publication here for network analysis. $\endgroup$
    – O.rka
    Commented Feb 20, 2022 at 19:21
7
$\begingroup$

A note:

You want to answer questions about your data, and not create questions about the visualization method itself. Often, boring is better. It does make comparisons of comparisons easier to comprehend too.

An Answer:

The need for simple formatting beyond R's base package probably explains the popularity of Hadley's ggplot package in R.

library(sn)
library(ggplot2)

# Simulate from a normal and skew-normal distributions
x = rnorm(250,0,1)
y = rsn(250,0,1,5)


##============================================================================
## I put the data into a data frame for ease of use
##============================================================================

dat = data.frame(x,y=y[1:250]) ## y[1:250] is used to remove attributes of y
str(dat)
dat = stack(dat)
str(dat)

##============================================================================
## Density plots with ggplot2
##============================================================================
ggplot(dat, 
     aes(x=values, fill=ind, y=..scaled..)) +
        geom_density() +
        opts(title = "Some Example Densities") +
        opts(plot.title = theme_text(size = 20, colour = "Black"))

ggplot(dat, 
     aes(x=values, fill=ind, y=..scaled..)) +
        geom_density() +
        facet_grid(ind ~ .) +
        opts(title = "Some Example Densities \n Faceted") +
        opts(plot.title = theme_text(size = 20, colour = "Black"))

ggplot(dat, 
     aes(x=values, fill=ind)) +
        geom_density() +
        facet_grid(ind ~ .) +
        opts(title = "Some Densities \n This time without \"scaled\" ") +
        opts(plot.title = theme_text(size = 20, colour = "Black"))

##----------------------------------------------------------------------------
## You can do histograms in ggplot2 as well...
## but I don't think that you can get all the good stats 
## in a table, as with hist
## e.g. stats = hist(x)
##----------------------------------------------------------------------------
ggplot(dat, 
     aes(x=values, fill=ind)) +
        geom_histogram(binwidth=.1) +
        facet_grid(ind ~ .) +
        opts(title = "Some Example Histograms \n Faceted") +
        opts(plot.title = theme_text(size = 20, colour = "Black"))

## Note, I put in code to mimic the default "30 bins" setting
ggplot(dat, 
     aes(x=values, fill=ind)) +
        geom_histogram(binwidth=diff(range(dat$values))/30) +
        opts(title = "Some Example Histograms") +
        opts(plot.title = theme_text(size = 20, colour = "Black"))

Finally, I've found that adding a simple background helps. Which is why I wrote "bgfun" which can be called by panel.first

bgfun = function (color="honeydew2", linecolor="grey45", addgridlines=TRUE) {
    tmp = par("usr")
    rect(tmp[1], tmp[3], tmp[2], tmp[4], col = color)
    if (addgridlines) {
        ylimits = par()$usr[c(3, 4)]
        abline(h = pretty(ylimits, 10), lty = 2, col = linecolor)
    }
}
plot(rnorm(100), panel.first=bgfun())

## Plot with original example data
op = par(mfcol=c(2,1))
hist(x, panel.first=bgfun(), col='antiquewhite1', main='Bases belonging to us')
hist(y, panel.first=bgfun(color='darkolivegreen2'), 
    col='antiquewhite2', main='Bases not belonging to us')
mtext( 'all your base are belong to us', 1, 4)
par(op)
$\endgroup$
2
  • $\begingroup$ (+1) Nice answer. I'd add alpha=0.5 to the first plot (to geom_density()) so the overlapping parts aren't hidden. $\endgroup$
    – smillig
    Commented May 17, 2012 at 20:00
  • $\begingroup$ I agree about the alpha=.5 I couldn't remember the syntax! $\endgroup$
    – geneorama
    Commented May 17, 2012 at 22:33
7
$\begingroup$

There is a concept specifically for comparing distributions, which ought to be better known: the relative distribution.

Let's say we have random variables $Y_0, Y$ with cumulative distribution functions $F_0, F$ and we want to compare them, using $F_0$ as a reference.

Define $$ R = F_0(Y) $$ The distribution of the random variable $R$ is the relative distribution of $Y$, with $Y_0$ as reference. Note that we have that $F_0(Y_0)$ has always the uniform distribution (with continuous random variables, if the random variables are discrete this will be approximate).

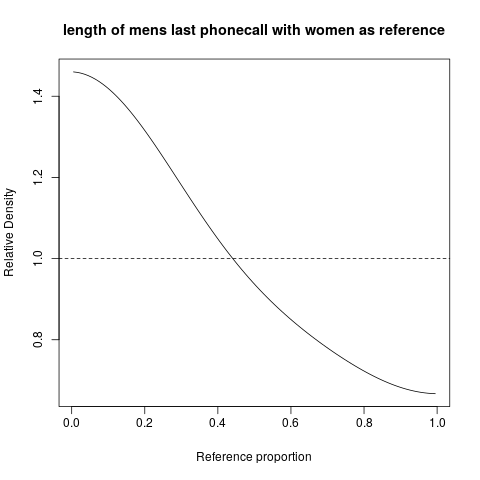
Let us look at an example. The website http://www.math.hope.edu/swanson/data/cellphone.txt gives data on the length of male and female students' last phone call. Let us express the distribution of phone call length for male students, with women students as reference.

Relative distribution of phone call length, men compared with women

We can see immediately that men (in this college class ...) tend to have shorter phone calls than women ... and this is expressed directly, in a very direct way. On the $x$ axis is shown the proportions in the women's distribution, and we can read that, for example, for the time $T$ (whatever it is, its value is not shown) such that 20% of women's calls were shorter (or equal) to that, the relative density for men in that interval varies between about 1.3 and 1.4. If we approximate (mentally from the graph) the mean relative density in that interval as 1.35, we see that the proportion of men in that interval is about 35% higher than the proportion of women. That corresponds to 27% of the men in that interval.

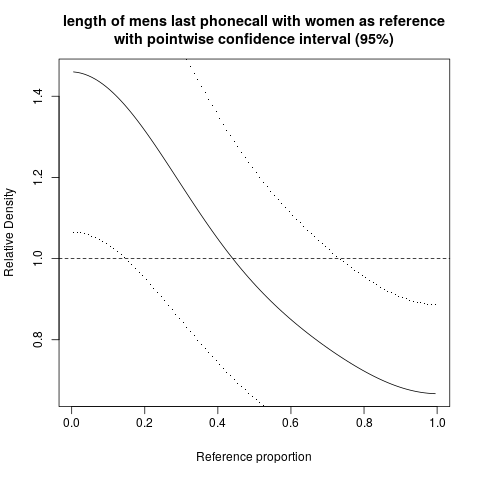
We can also make the same plot with pointwise confidence intervals around the relative density curve:

plot of relative distribution with pointwise confidence interval

The wide confidence bands in this case reflects the small sample size.

There is a book about this method: Handcock

The R code for the plot is here:

    phone <-  read.table(file="phone.txt", header=TRUE)
    library(reldist)
    men  <-  phone[, 1]
    women <-  phone[, 3]
    reldist(men, women)
    title("length of men's last phonecall with women as reference")

For the last plot change to:

    reldist(men, women, ci=TRUE)
    title("length of men's last phonecall with women as 
           reference\nwith pointwise confidence interval (95%)")

Note that the plots are produced with use of kernel density estimation, with degree of smoothness chosen via gcv (generalized cross validation).

Some more details about the relative density. Let $Q_0$ be the quantile function corresponding to $F_0$. Let $r$ be a quantile of $R$ with $y_r$ the corresponding value on the original measurement scale. Then the relative density can be written as $$ g(r) = \frac{f(Q_0(r))}{f_0(Q_0(r))} $$ or on the original measurement scale as $g(r)=\frac{f(y_r)}{f_0(y_r)}$. This shows that the relative density can be interpreted as a ratio of densities. But, in the first form, with argument $r$, it is also a density in own right, integrating to one over the interval $(0,1)$.

That makes it a good starting point for inference.

$\endgroup$
2
  • 3
    $\begingroup$ The examples in that book are wonderful. In practice my limited experiments were disappointing to me. You need a lot of data for this to work well, whereas doubts about distributions seem most acute for small or moderate samples. $\endgroup$
    – Nick Cox
    Commented Feb 25, 2022 at 16:58
  • $\begingroup$ Yes, those methods are mostly for large data, not so much for doubts about distributions, but to compare distributions. For instance, not only compare mean (or media, ...) income between groups, but compare the complete income distributions. $\endgroup$ Commented Feb 25, 2022 at 21:02
4
$\begingroup$

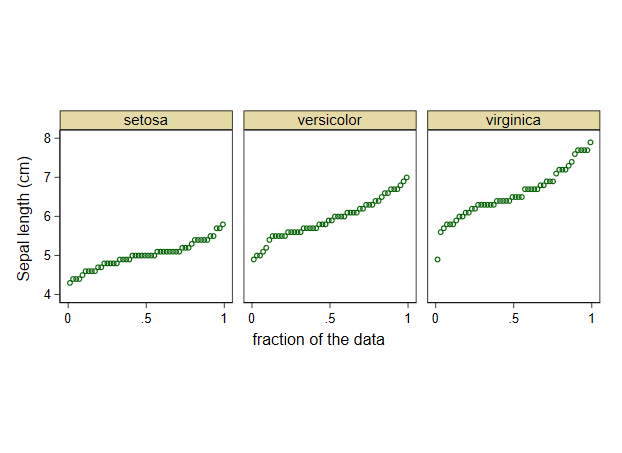
I strongly recommend quantile plots, here in the first instance plots of the data in rank order (observed quantiles) against cumulative probability. Many quantile plots are explicitly plots against some other quantiles, and may be called quantile-quantile plots or QQ-plots. A plot against cumulative probability is not an exception as values on the horizontal axis are quantiles of a uniform (rectangular, flat) distribution on the unit interval. Although quantiles in statistics are often (usually!) particular summary points, such as quartiles, deciles, or percentiles, in this graphical context quantiles are simply all the ordered data, or equivalently the order statistics of several values on some variable.

Quantile plots entail no arbitrary decisions about binning or smoothing and represent the data as they arrive, showing level, spread, and shape (including outliers, gaps, spikes and other detail as it occurs). A convention to show data points as points is just that; for a large sample the pattern of points often blurs into a line, which is genuine whenever it is observed and not a limitation. Line representations are also possible.

Here I echo a previous answer and use the Iris data from E.S. Anderson, as made famous by R.A. Fisher.
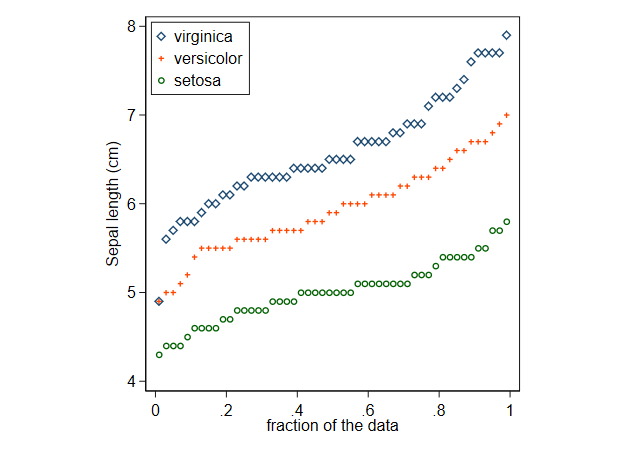
enter image description here

enter image description here

The choice between superimposed and juxtaposed should always be one of which works best. In this example superimposition works well, although with other datasets it can lead to tangled spaghetti. The picture for these data is mostly that the subsets differ in level, with loosely similar spread and shape, although extra detail can be spotted (e.g. conventional rounding in reporting results and a mild outlier on virginica).

Quantile plots can be smoothed, although this seems rarely done. Conversely, it can be argued that reducing data to a smaller set of say letter values preserves most of the information on each distribution. This paper is a gateway to older literature. Although named by John W. Tukey, letter values go back at least to Francis Galton.

Quantile plots can even be used for categorical data so long as they have numerical codes. The stepped nature of the resulting plots is realistic and if the point is to compare the same variable for different subsets, or for similar variables, the essential is just that values are coded consistently, which is hardly demanding.

A default quantile plot just plots observed values against an associated cumulative probability, in this context often called a plotting position.

In many cases it will be a good idea to plot against some theoretical quantile, essentially the result of pushing a plotting position through a quantile function. This is natural if a particular distribution is in mind, or at least a particular distribution may serve as a reference distribution. As many authors have noted, taking a normal (Gaussian) distribution as reference may be quite widely convenient. It is exactly the right thing to do if comparisons with normal distributions are of direct concern, and not absurd even if they aren't. The use of normal distribution as reference no more implies that data are, or should be, normally distributed, than does comparing shapes with circles or spheres, comparing altitudes with sea level, or comparing temperatures with the freezing point of water. If some other family of distributions is a better reference, say gamma or exponential, then use it. Similarly, monotonic transformations of the observed quantiles (e.g. a logarithmic scale) may often help, the essential being that such transformations preserve order.

The same information in principle is encoded in (empirical (cumulative)) distribution function plots (ECDF plots) or in survival function plots. In practice, quantile plots can make it easier to look at tail behaviour closely, while ECDF plots perhaps make comparisons of middles of distributions slightly easier. The choice often comes down to tribal habits as much as personal taste or comparisons of which work best in some sense.

This is, or should be, very easy in R, and indeed in your favourite statistical or mathematical software if different. If not, you need a new favourite.

$\endgroup$
2
$\begingroup$

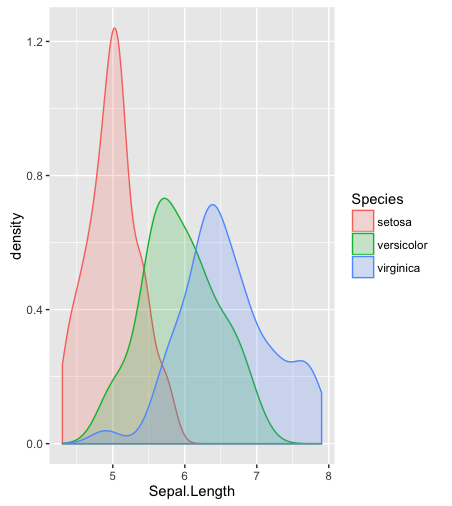
I like to just estimate the densities and plot them,

head(iris)
  Sepal.Length Sepal.Width Petal.Length Petal.Width Species
1          5.1         3.5          1.4         0.2  setosa
2          4.9         3.0          1.4         0.2  setosa
3          4.7         3.2          1.3         0.2  setosa
4          4.6         3.1          1.5         0.2  setosa
5          5.0         3.6          1.4         0.2  setosa
6          5.4         3.9          1.7         0.4  setosa

library(ggplot2)
ggplot(data = iris) + geom_density(aes(x = Sepal.Length, color = Species, fill = Species), alpha = .2)

enter image description here

$\endgroup$
5
  • $\begingroup$ Why do you colour the inside of the pdf (below the curve)? $\endgroup$
    – wolfies
    Commented Apr 18, 2016 at 14:44
  • $\begingroup$ I think it looks prettier. $\endgroup$ Commented Apr 18, 2016 at 15:19
  • 1
    $\begingroup$ Perhaps - but it can convey the incorrect impression - of conveying mass or area, that may be visually inappropriate. $\endgroup$
    – wolfies
    Commented Apr 18, 2016 at 17:10
  • 1
    $\begingroup$ It conveys empirical probability mass. $\endgroup$ Commented Mar 24, 2017 at 18:55
  • 1
    $\begingroup$ The truncation of density estimates in the display deserves explanation. There are devices to avoid smearing mass into impossible regions (here zero or negative lengths) but they are rarely used in my reading. Here the smearing is omitted. $\endgroup$
    – Nick Cox
    Commented Feb 25, 2022 at 8:23

Your Answer

By clicking “Post Your Answer”, you agree to our terms of service and acknowledge you have read our privacy policy.

Not the answer you're looking for? Browse other questions tagged or ask your own question.