3
$\begingroup$

I'm reading an intro to statistics book where it shows how to calculate a confidence interval using a sample of size N, then taking the mean and standard deviation of that sample as point estimates to use in the calculation.

What I'm wondering is, if instead of one sample you take multiple samples to create a sampling distribution, can you use the mean and std of the sampling distribution to calculate a confidence interval instead?

$\endgroup$
3
  • 1
    $\begingroup$ Are you assuming that the distribution(s) are Gaussian? $\endgroup$ Commented Jun 8, 2017 at 20:34
  • $\begingroup$ Hmm I think approximately normal based on the central limit theorem. I don't have a good grasp of the CLT's conditions, but say I take 5 samples of size 100 each. Would using the mean/std of this change things instead of just using a single sample of size 100 to get my sample mean/ standard error? $\endgroup$
    – Austin
    Commented Jun 8, 2017 at 20:38
  • 1
    $\begingroup$ Also for sampling distributions, I see a lot of literature about the required sample size for an individual sample, but nothing really on the number of samples needed for the CLT to be true. Is there any rule for this? $\endgroup$
    – Austin
    Commented Jun 8, 2017 at 20:44

1 Answer 1

3
$\begingroup$

You could (and the fact that you ask means you understand the idea of a sampling distribution better than most) ... but you wouldn't want to.

TL;DR - it wouldn't be the best use of your data.

Let's consider two dueling options:

  1. Take ten samples of size 10, take the average of each sample, and use the mean & sd of your sample averages to describe your sampling distribution.
  2. Take one sample of size 100, and appeal to the CLT.

Under option (1), what you'd be describing is the sampling distribution for a sample of size 10. (Plus, you'd have to assume that your ten sample averages give an accurate estimate of the standard error, a subject for another day). Regardless, you'd have to assume normality.

Under option (2), you have the sampling distribution for a sample of size 100. Not only will this be much more nearly Normal, it will be much narrower (about 32% as wide), which will allow you to construct a much narrower interval, and will be much more useful for inference.

"But wait... what if I just took a LOT of samples! I wouldn't have to assume normality anymore!"

That's true! If you took enough samples, you could just use the quantile values of your sample averages to construct a confidence interval ... but it would still be based on the distribution of a sample of size 10 - much wider than it could be.

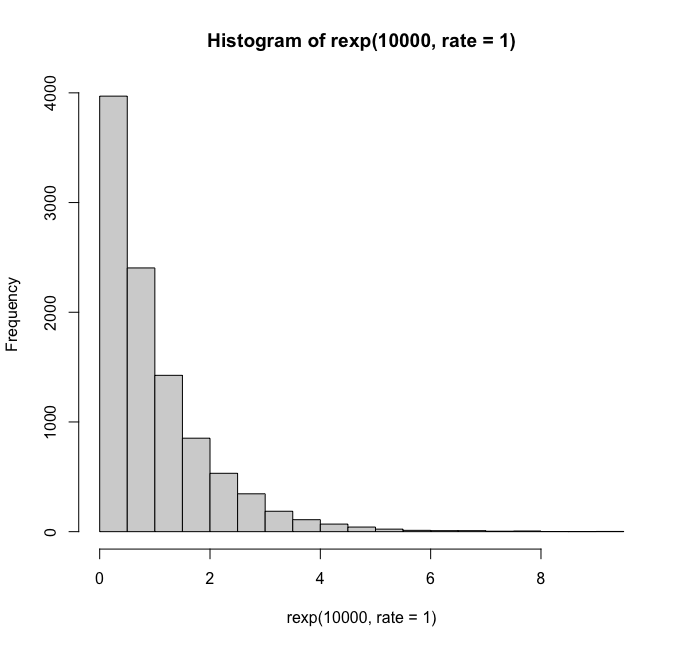
Here's a simulation in R. I'll draw samples from an exponential distribution, which is about as non-Normal as you can get.

hist(rexp(10000, rate=1))   # Ick!
enter image description here

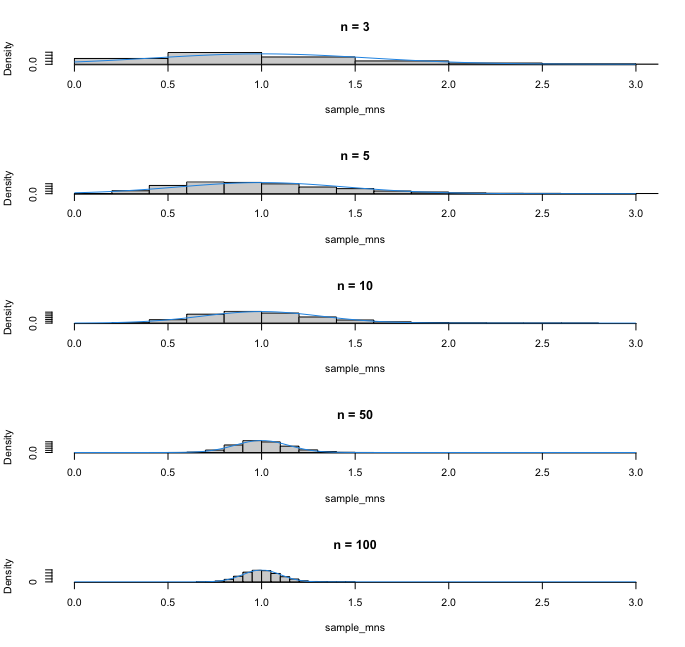
Here's what sampling distributions look like for sample sizes of 3, 5, 10, 50, and 100. The histogram gives the distribution of 10,000 random samples for each trial sample size, and the blue curve is the normal approximation of the sampling distribution.

ntrial <- c(3, 5, 10, 50, 100)
par(mfrow=c(5,1))
for(n in ntrial) {
  sample_mns <- replicate(10000, mean(rexp(n, rate=1)))
  hist(sample_mns, main=paste("n =",n), xlim=c(0,3), freq=F)
  curve(dnorm(x, mean=1, sd=1/sqrt(n)),add=T,col=4)
}
enter image description here

So, as sample size increases, the magic of the CLT allows us to work with a much nicer sampling distribution, both in terms of shape and width.

$\endgroup$
6
  • $\begingroup$ Thanks for your answer. I might not understand the sampling distribution as well as we thought, because I still have a couple points of confusion. In option #2, since only one sample of size 100 has been taken, if you calculate this sample's mean, aren't you only left with a point estimate instead of any actual distribution (you could have a histogram of values, but only a single mean point)? $\endgroup$
    – Austin
    Commented Jun 9, 2017 at 22:07
  • $\begingroup$ (cont.) I thought that in order to appeal to CLT, you had to both have samples of sufficient size, and have multiple samples to form a distribution from which you can obtain a mean of sample means. So, is CLT saying a single (large) sample's mean can approximate the population mean, or that the mean of multiple (large) sample means can approximate the population mean? I took it to mean the latter, but now I'm not so sure. $\endgroup$
    – Austin
    Commented Jun 9, 2017 at 22:07
  • 1
    $\begingroup$ Believe it or not, you can use a single sample. The mean of a single sample will always be distributed with a mean equal to the population mean and a sd equal to the pop sd over sqrt(n). What the CLT adds is the shape of the distribution. Since the pop mean & sd are unknown, we can use the sample avg & sd to approximate them. $\endgroup$
    – Matt Tyers
    Commented Jun 9, 2017 at 22:17
  • 1
    $\begingroup$ In practical terms, the idea of a sampling distribution is more of a hypothetical. You'll (probably) only ever take one sample, but the easiest way to think about the distribution of the sample avg is with the (hypothetical) idea of taking several (hypothetical) samples. $\endgroup$
    – Matt Tyers
    Commented Jun 9, 2017 at 22:21
  • 2
    $\begingroup$ from the CLT, if you have a large enough sample (30-50 or so), the sample avg is approximately normally distributed with mean equal to the pop mean and sd equal to the pop sd over sqrt(n). Confidence intervals will be constructed around the sample average, and hypothesis tests will use some hypothesized value for the pop mean (and compare the sample mean to it). Either case will use the sample sd to approximate the pop sd, but will use the t-distribution (a little wider than normal) to account for that added uncertainty in estimating the sd. $\endgroup$
    – Matt Tyers
    Commented Jun 9, 2017 at 22:29

Your Answer

By clicking “Post Your Answer”, you agree to our terms of service and acknowledge you have read our privacy policy.

Not the answer you're looking for? Browse other questions tagged or ask your own question.