I have time series as
0.4385487 0.7024281 0.9381081 0.8235792 0.7779642 1.1670665 1.1958634 1.1958634 0.8235792 0.8530141 0.8802216 1.1958634 1.1235897 1.3542734 1.3245534 0.9381081 1.1670665 1.1958634 0.8802216 1.3542734 1.1670665 4.9167998 0.9651803 0.8221709 1.1070461 1.2006974 1.3542734 0.9651803 0.9381081 0.9651803 0.8854192 1.3245534 1.1235897 1.2006974 1.1958634 0.4385487 1.3245534 4.9167998 1.2277843 0.8530141 1.0018480 0.3588158 0.8530141 0.8867365 1.3542734 1.1958634 1.1958634 0.9651803 0.8802216 0.8235792 4.9167998 1.1958634 0.9651803 0.8854192 0.8854192 1.2006974 0.8867365 0.9381081 0.8235792 0.9651803 0.4385487 0.9936722 0.8821301 1.3542734 1.1235897 1.6132899 1.3245534 1.3542734 0.8132233 0.8530141 1.1958634 1.2279813 0.8354292 1.3578511 1.1070461 0.8530141 0.9670581 1.1958634 0.7779642 1.2006974 1.1958634 0.8235792 1.3245534 0.5119648 2.3386331 0.8890464 0.8867365 4.9167998 1.2006974 1.2006974 0.6715839 4.9167998 0.7747481 4.9167998 0.8867365 1.2277843 0.8890464 1.2277843 0.8890464 1.0541099 0.8821301
I am using package "itsmr"-autofit(),"forecast"-auto.arima(),"package"--functions
Autoregressive model
> ar(t)

Call:
    ar(x = t)

    Order selected 0  sigma^2 estimated as  0.9222
ARMA model
> autofit(t)
    $phi
    [1] 0

    $theta
    [1] 0

    $sigma2
    [1] 0.9130698

    $aicc
    [1] 279.4807

    $se.phi
    [1] 0

    $se.theta
    [1] 0
ARIMA model
    > auto.arima(t)
    Series: t
    ARIMA(0,0,0) with non-zero mean

    Coefficients:
          intercept
             1.2623
    s.e.     0.0951

    sigma^2 estimated as 0.9131:  log likelihood=-138.72
    AIC=281.44   AICc=281.56   BIC=286.67
The auto.arima function automatically differences time series: we don't have to worry about transformation.
> auto.arima(AirPassengers)
Series: AirPassengers
ARIMA(0,1,1)(0,1,0)[12]

Coefficients:
          ma1
      -0.3184
s.e.   0.0877

sigma^2 estimated as 137.3:  log likelihood=-508.32
AIC=1020.64   AICc=1020.73   BIC=1026.39`
Which model should I select to get p,q values & for forecasting purpose?

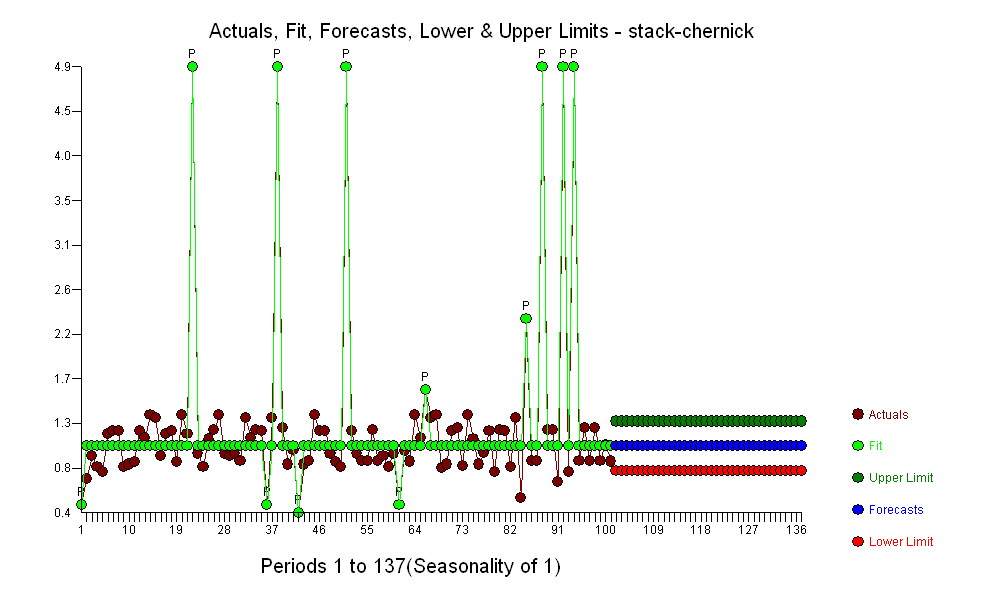
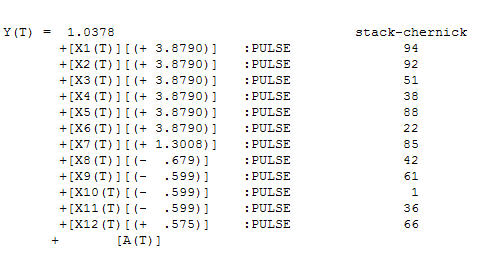
 suggest a Mean Model where the forecast would be based upon the following equation
  . Note that there are 12 anomalous data points yielding a robust mean of 1.0378 . The visual definitely supports the unusual data points. Good time series analysis detecting the underlying signal ( a mean model ) while also detecting any exceptional data points rendering a cleansed/robust mean of 1.0378 as compared to a simple mean of 1.26 . Now that the anomalous points have been identified , one needs to ask what they have in common as a possible explanatory variable. Additionally the ACF of the errors from this model indicate randomness. Furthermore there is no evidence that the expected value is systematic with the error variance or error standard deviation suggesting that a power transform is not warranted. Finally there is no evidence of a structural shift in the robust mean over time suggesting that the parameter(s) of the model are invariant.