General
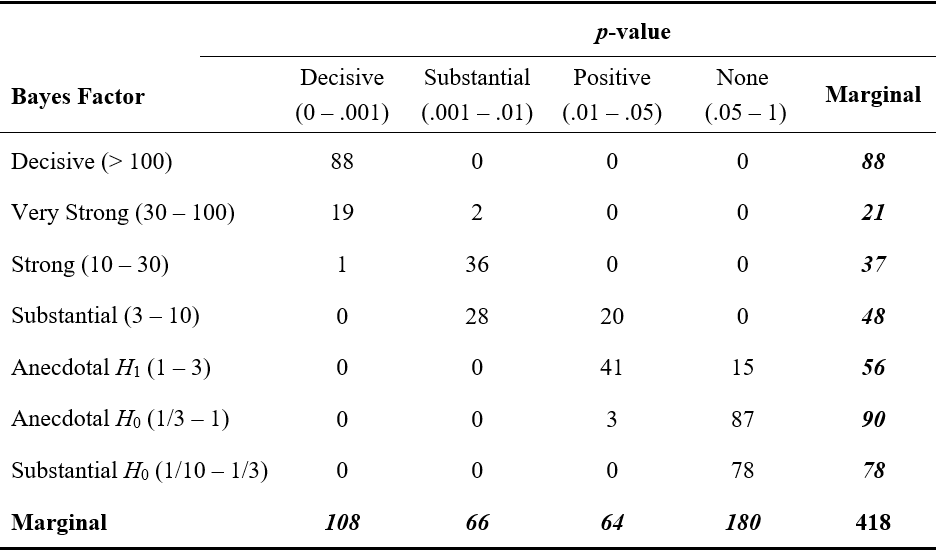
This is a contingency table. It shows you for every possible combination of Bayes Factor and p-value, how many time it occurred in your data. The entries in your table are counts (AKA frequencies). The bold-faced numbers in the margins of the table are the row and column totals.
2 Examples
For example, you can read from the table that:
- there are 418 data points.
- 108 of those have
p-value of Decisive.
- That correspond to a probability of $108/418 = 0.258$
Another example: 28 observations have a Bayes' Factor of Substantial while also having Substantial for the p-value. That corresponds to a probability $28/418 = 0.067$
Conditional frequency distribution
Taking it a step further. You can also only focus on 1 row or column of the table. By doing this, you can make statements such as: Conditional on a positive p-value, there is a probability of 20/61 = 0.328 that the observation has a value of Substantial for the Bayes' Factor. By focusing on 1 row or column, you are focusing on marginal distributions, i.e. conditional distributions.
Update
In response to your comment, I will deal with the two follow up questions you posed:
- What is
P(p.value = Positive | Bayes Factor = Substantial)?
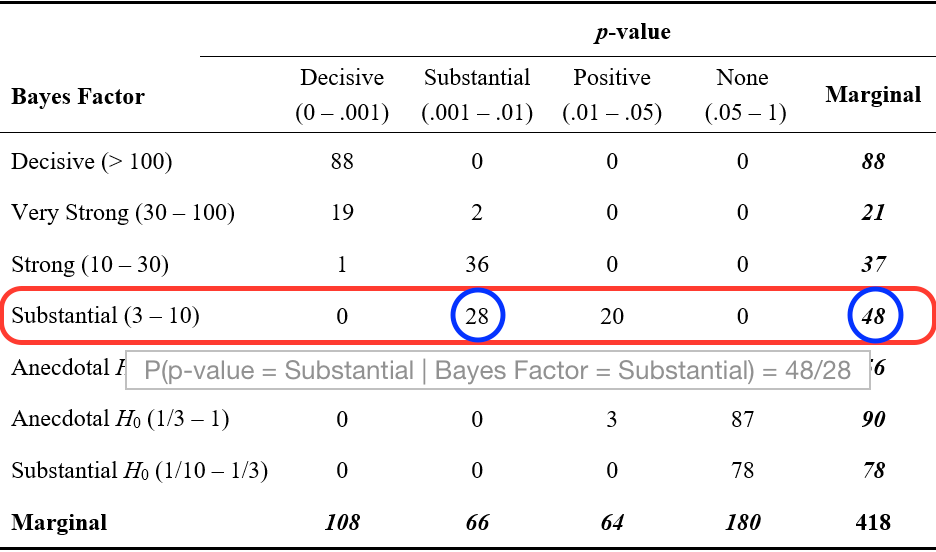
Since we condition on Bayes Factor = Substantial, we will ignore all rows, except Bayes Factor = Substantial and take that row's total as our total (The blue circled 48). Then we look for the column where p-value = Substantial and see there are 28 (blue circled 28) observations:
P(p.value = Positive | Bayes Factor = Substantial) = 28/48

- What is
P(Bayes Factor = Substantial | p.value = Positive)?
With the same logic, we should now look at the p-value = Positive column and ignore all the rest. In that column, search for the cell where Bayes Factor = Substantial and divide the two:
P(Bayes Factor = Substantial | p.value = Positive) = 64/20


