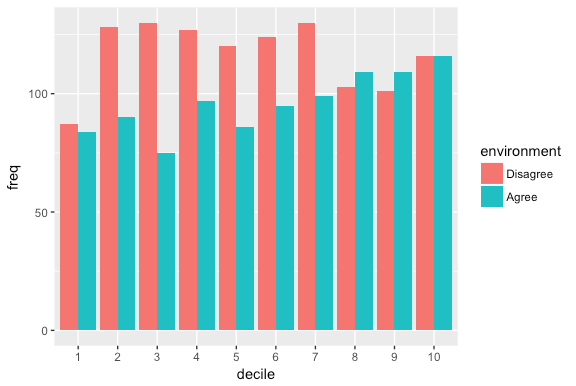
I have survey data on income and support for environmental protection. Income is a continuous variable that I have broken up into deciles. I have a hypothesis that support for protection ('Agree') will be concentrated not in the very top of the income spectrum, but in the second and third decile. So my question is how should I set the contrasts. In my mind I should compare the value of each decile to the average of all the (other?) deciles? Comparing each decile to the lowest, highest or middle won't capture what I am looking for. Helmert contrasts will get close, I think, but it would compare the first decile to the average of all below it, including the second and third, and I don't think I want that.
This is partially a question about modelling strategy and partially a question about how to implement contrasts in R. A plot of my real data is shown below the code to generate the sample data.
var1<-sample(c('A', 'B'), replace=T, size=10000)
var2<-as.factor(sample(seq(1,10,1), replace=T, size=10000))
df<-data.frame(var1=var1, var2=var2)

