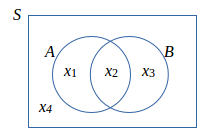
Independence means the Venn diagram can be drawn in a simpler way.
After presenting a simple analysis, which is trivial but enlightening, I offer a way of visualizing and generalizing independence and then discuss some of its uses and implications.
Analysis
Two events $A$ and $B$ in the same probability space $\Omega$ determine four events altogether by means of their complements ${A}^\prime = \Omega\setminus A$ and ${B}^\prime = \Omega\setminus B$; namely, the four possible nontrivial intersections $A\cap B$, $A\cap B^\prime$, $A^\prime \cap B$, and $A^\prime \cap B^\prime$. These four events are mutually exclusive--any two have null intersection--and their union is all of $\Omega$.
In general, the probabilities associated with these four intersections could be any values consistent with the axioms: they must be non-negative and sum to unity. (This implies three parameters are needed to describe all such probabilities; the fourth probability is determined by the sum-to-unity constraint.) But when $A$ and $B$ are independent, this simplifies.
Recall that $A$ and $B$ are independent when $\Pr(A\cap B)=\Pr(A)\Pr(B)$. Notice this implies that $A$ and $B^\prime$ are independent, because
$$\eqalign{\Pr(A)&=\Pr(A\cap \Omega) = \Pr(A\cap(B\cup B^\prime))=\Pr((A\cap B)\cup(A\cap B^\prime)) \\&= \Pr(A\cap B)+\Pr(A\cap B^\prime)}$$
implies
$$\eqalign{\Pr(A\cap B^\prime) &= \Pr(A) - \Pr(A\cap B) = \Pr(A) - \Pr(A)\Pr(B) = \Pr(A)\left(1 - \Pr(B)\right) \\&= \Pr(A)\Pr(B^\prime).}$$
Exchanging the roles of $A$ and $B$ in this argument shows $A^\prime$ and $B$ are independent and, finally, replacing $B$ with $B^\prime$ (whence $B^{\prime\prime}=B$) shows $A^\prime$ and $B^\prime$ are independent.
Visualization
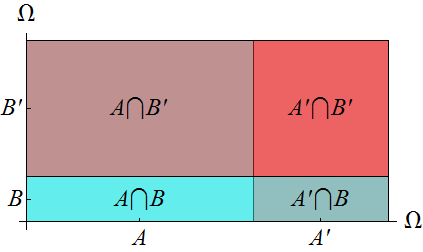
This analysis can be depicted by representing $\Omega$ (abstractly) as an interval of points on an axis. $A$ is a subset of this interval and $A^\prime$ is the remainder of the subset. I will make the lengths of these subintervals proportional to their probabilities.
Let's erect another vertical axis, again representing $\Omega$, on which we may draw $B$. We are free to re-order the elements of $\Omega$ on this axis so that $B$ also appears as a subinterval and $B^\prime$ is the remainder, again drawn with lengths proportional to their probabilities.

These intervals determine rectangles in the figure, as shown. Independence of $A$ and $B$ means the relative areas of the rectangles are their probabilities.
Discussion
Now only two parameters, instead of three, are needed to describe all possible probability distributions: $\Pr(A)$ and $\Pr(B)$ completely determine all the rectangle areas.
This idea generalizes. Let $A_1, A_2, \ldots, A_m$ be events that partition $\Omega$: that is, the intersection of any distinct pair of them is empty and their union is $\Omega$. Let $B_1, B_2, \ldots, B_n$ be another partition. These two partitions are independent when $\Pr(A_i\cap B_j) = \Pr(A_i)\Pr(B_j)$ for all $i,j$. We may draw a similar figure in which the $A_i$ are a sequence of non-overlapping line segments on the x axis and the $B_j$ are a sequence of non-overlapping line segments on the y axis, each with a length proportional to the probability. This generalized idea of independence simply means the probabilities of all $m\times n$ rectangles formed by these seqments are determined by the $m$ probabilities for the $A_i$ and the $n$ probabilities for the $B_j$. That replaces $mn$ numbers (subject to a single sum-to-unity constraint) by $m+n$ numbers (subject to two separate sum-to-unity constraints). The reduction in parameter counts from $mn-1$ to $m+n-2$ quantifies how much simplification has occurred. It's substantial.
This kind of diagram can help your intuition in various ways. When you think of independence, think of two one-dimensional axes filling out a two-dimensional region and think of areas of rectangles determined by the lengths of their sides. If you progress in your study of probability far enough theoretically, eventually you will encounter generalizations in which the concept of independence extends to "sub sigma algebras." (A sub sigma algebra is a collection of events having some additional properties that don't matter here. It's a way to generalize the finite partitions, as previously described, into infinite partitions.) If you visualize a "sub sigma algebra" as a collection of intervals on a line (although this time they may overlap each other), you will not need to enlarge or modify your intuition one bit: this hugely general and abstract definition of independence merely says that any rectangle formed by a set on the x-axis and a set on the y-axis has a probability proportional to its area.
Yet another generalization extends to independence of three or more sets (or sub sigma algebras). Visualize these by adding more axes to the picture: a third axis in a third dimension for the third set (now the relevant probabilities are volumes of cuboids), and so on. In effect, independence lets us break down a potentially complicated probability space into simpler "one-dimensional" components, almost in the same way we analyze vectors (in vector spaces) in terms of their components.


