As part of my Master Thesis, I'm designing a relatively simple Biomes Distribution Model. The aim of the model is to predict biomes (macro vegetation types) spatial distribution on Earth, using some (mainly climatic) data as input. I have 24 different variables I can use as input for the model. First I ran principal component analysis http://desktop.arcgis.com/en/arcmap/latest/tools/spatial-analyst-toolbox/how-principal-components-works.htm to sort predictor variables in order of importance. Then I performed a forward selection, starting with the simplest model having just one predictor, up to the most complex model having all 24 input variables. Model is based on Maximum Likelihood Classification:
h ttp://desktop.arcgis.com/en/arcmap/latest/tools/spatial-analyst-toolbox/how-maximum-likelihood-classification-works.htm
(sorry, don't have enough reputation to post another link...).
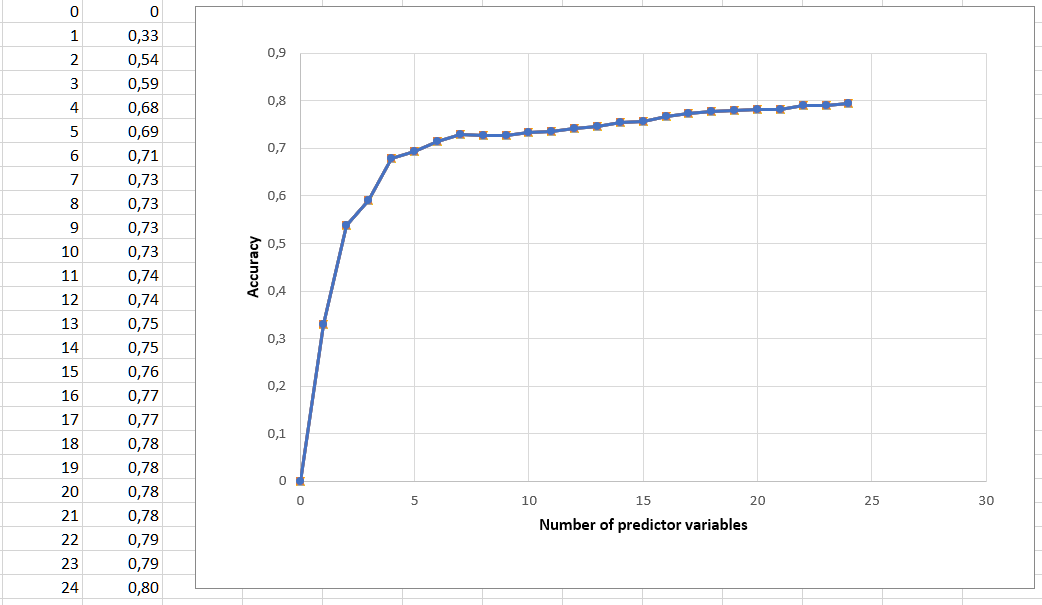
I used groundtruth data (which I have available for the whole Earth) as training data. For every model, from the simplest to the most complex, I ran the classification and calculated Cohen's Kappa statistics as a measure of goodness of fit. I got this training accuracy curve: 
As I had the suspicion that using all 24 variables model was overfitting, I wrote the code to perform a 3-fold cross validation (as explained on Wikipedia's Cross-validation article) and re-ran calculations to get the test (or validation) accuracy curve. I was expecting that this new curve would be decreasing after a global maximum for the effects of overfitting. Instead, test accuracy curve came out (almost) identical to the training curve. How to interpret this result? Does it mean that there was no overfitting in the first place?
