5
$\begingroup$

I know that if we have a two-dimensional data set, convert the points to standard units (subtract the mean, and divide by the standard deviation), and then do simple linear regression, then the slope of the resulting linear regression line is equal to the correlation coefficient. Or, to put it another way, the slope of the regression line (in original units) is given by $b = r \sigma_y / \sigma_x$, where $\sigma_x$ is the standard deviation of the $x$-values and $\sigma_y$ is the standard deviation of the $y$-values.

Why is that? Is there some way to get some intuition for why this should be? I'm not looking for a mathematical derivation; I'd prefer something that focuses on intuition and that will it make sense to someone new to the topic.

$\endgroup$
2
  • 2
    $\begingroup$ Although my answer at stats.stackexchange.com/a/71303/919 is pictorial, and therefore mathematical, the subject is inherently a mathematical one: correlation and regression are statistical properties but their relationship is a mathematical theorem. One objective of that answer was to provide intuition concerning why $b$ and $r$ must be equal for standardized data. Much of the analysis there does not require bivariate normality, either. $\endgroup$
    – whuber
    Commented Nov 3, 2017 at 16:20
  • $\begingroup$ @D.W. did you find what you were looking for? I have similar question, and had asked it here math.stackexchange.com/questions/2901647/… $\endgroup$
    – q126y
    Commented Sep 4, 2018 at 4:32

2 Answers 2

3
$\begingroup$

Basically a correlation coefficient calculates the line of best fit between two variables. It does so using the formula for covariance.

The regression is also finding the line of best fit. But typically this is done using the least squares algorithm. It just so happens that linear regression and correlations are mathematically equivalent in this case.

So they're both trying to accomplish the same thing. Minimizing the (squared) distance between each point and the line of best fit. And in this particular case the two approaches are mathematically identical. But regression can be extended to many predictors, whereas correlation coefficient can only be between two.

Another way to think about it is that the slope represents how one variable changes as you increase the other. And this what you're looking for in both correlation and regression. You're looking for how changes in one variable lead to changes in another.

Edit: think about it this way. If slope = 0, as you increase one variable, the other variable doesn't change at all. This means no relationship.

On the other hand, if slope = 1, as you increase the first variable by one unit you increase the other by one unit as well. This means that the variable are related. If the slope = 10,000 then if you increase one variable by 1, the other one increases by 10,000. This is a very strong relationship!

But anything that is non-zero can be a strong relationship if the line of best fit fits the data well. If the data is all scattered and not close to the line of best fit, the slope may be large, but fit the data so badly that we don't really trust it. The significance test of both correlation coefficient and regression are testing whether the slope is non-zero and fits the data well enough to "trust".

$\endgroup$
8
  • $\begingroup$ Thanks for taking the time to answer! "It just so happens that [they] are mathematically equivalent" - Yeah. I'm trying to get some intuition for why this is true. I'm hoping for something more than "the math just turns out that way". If the slope of the linear regression line is large, why should that tend to indicate a larger correlation coefficient, or vice versa? "a correlation coefficient calculates the line of best fit between two variables" - Perhaps a different way to answer would be to provide some intuition for why the formula for the correlation coefficient does this. Any ideas? $\endgroup$
    – D.W.
    Commented Nov 3, 2017 at 15:33
  • $\begingroup$ @D.W. added some more explanation to my answer. Hope that helps. $\endgroup$
    – Adam B
    Commented Nov 3, 2017 at 16:01
  • $\begingroup$ This answer seems to overlook the basic question: a correlation coefficient is a symmetric function of paired variables. It definitely is not intended to compute a "line of best fit," which--because "best fitting" treats the variables asymmetrically--it obviously is not doing. Indeed, there are two distinct "lines of best fit": the linear regression of $Y$ against $X$ and the linear regression of $X$ against $Y$. $\endgroup$
    – whuber
    Commented Nov 3, 2017 at 16:16
  • $\begingroup$ X against y and y against x are mathematically identical models. You'll get the same p value and the regression coefficients are the inverse of one another. $\endgroup$
    – Adam B
    Commented Nov 3, 2017 at 16:20
  • $\begingroup$ They are totally different models statistically: one minimizes residuals of $Y$ and the other minimizes residuals of $X$! You seem to be caught up in a circular chain of claims. It's time to actually prove some of them... . $\endgroup$
    – whuber
    Commented Nov 3, 2017 at 16:21
0
$\begingroup$

This is due to regression towards the mean.

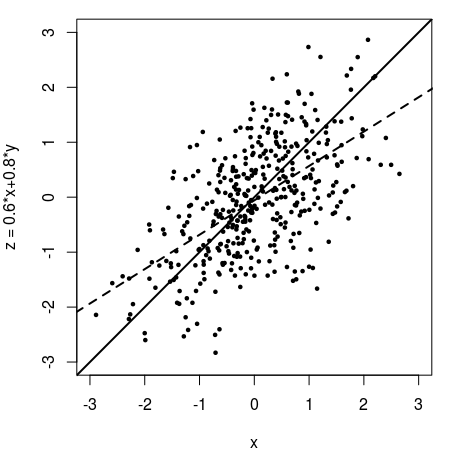
Example: Let's consider we have $X$ and $Y$ standard normal distributed and a third variable $Z$ is a function of according to the formula

$$Z = 0.6 X + 0.8 Y$$

In this case we have $\sigma_Z = \sigma_X = 1$.

But when we predict $Z$ based on $X$, then we have a line that is closer to the mean than the line $Z=X$. This is because $Z$ only partly depends on $X$.

enter image description here

$\endgroup$

Your Answer

By clicking “Post Your Answer”, you agree to our terms of service and acknowledge you have read our privacy policy.

Not the answer you're looking for? Browse other questions tagged or ask your own question.