0
$\begingroup$

I had a previous poorly redacted four-options questionnaire where answers followed a narrowed distribution, which is not giving me enough information and did not matched to data I measured after.

After a redesign of the test, I passed the questionnaire to different samples, and repeated the experiment so I got a more uniform distributions, which are actually more close to experiment.

Since its a 20 question questionnaire and not Likert, neither an ordinal scale, neither options are related or ordered..., just merely categorical, I am not sure median quartiles makes sense here.

Is there any statistics that shows that overall on the second questionnaire I obtain a more uniform distributions and more variation on responses?

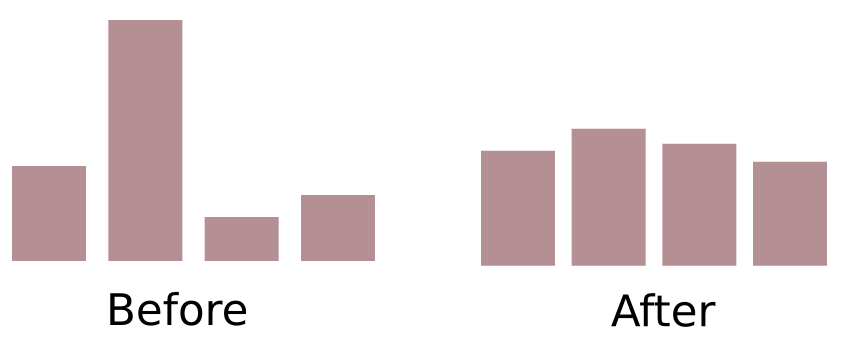
Example of data from a question before redaction change

$\endgroup$
2
  • 1
    $\begingroup$ Can you give some sample or toy data? I don't understand what you did or what you are asking. $\endgroup$ Commented Nov 11, 2017 at 19:42
  • $\begingroup$ The goal is to improve a set of twenty questions to gather common students misconceptions about a lesson, just before the teacher start his instruction. On the previous test "Before", we didn't gather many relevant data. We changed wording of questions. And on "After" we obtained a more wide set of misconceptions (more according to what the teacher reports). I am looking for a way to measure the difference from "Before" (a narrow distribution of categorical data) to the "After" (uniform distribution of same categorical data but better results with the new wording of questions) $\endgroup$
    – Emc2
    Commented Nov 11, 2017 at 20:17

1 Answer 1

1
$\begingroup$

One possibility is to use Cramer's v adapted for use in chi-square goodness of fit tests.

A variant of Cramer's v is described in Wikipedia. It takes the chi-square value from a chi-square goodness-of-fit test and divides it by the product of the total observations and the number of categories minus one, and takes the square root of this value.

In your case you can think about expected frequencies for the chi-square test to be equally divided among categories.

In this case, Cramer's v will be equal to 1 when all the observations fall in one category, and will be equal to 0 when the observations are equally divided among categories. Cramer's v is not affected by sample size.

So, in your case, the larger Cramer's v, the more unevenly distributed the categories.

An example in R.

Before          = c(6, 15, 4, 5)

Before.expected = c(0.25, 0.25, 0.25, 0.25)

X2Before = chisq.test(x = Before,
                      p = Before.expected)

X2Before

    ###  Chi-squared test for given probabilities

    ###  data:  Before
    ###  X-squared = 10.267, df = 3, p-value = 0.01643

X2 = X2Before$statistic

N = sum(Before)

K = length(Before)

CramerV = sqrt(X2 / (N*(K-1)))

names(CramerV) = "Cramer's V"

CramerV

   ###  Cramer's V 
   ###   0.3377485 


#     #      #

After          = c(7, 9, 7, 7)

After.expected = c(0.25, 0.25, 0.25, 0.25)

X2After = chisq.test(x = After,
                     p = After.expected)

X2After

X2 = X2After$statistic

   ###  Chi-squared test for given probabilities

   ###  data:  After
   ###  X-squared = 0.4, df = 3, p-value = 0.9402

N = sum(After)

K = length(After)

CramerV = sqrt(X2 / (N*(K-1)))

names(CramerV) = "Cramer's V"

CramerV

   ###   Cramer's V 
   ###  0.06666667 

I added a function to my rcompanion package for Cramér's V for situations like chi-square goodness-of-fit.

if(!require(rcompanion)){install.packages("rcompanion")}

library(rcompanion)

Before = c(6, 15, 4, 5)

 ### Cramer V 
 ###   0.3377 

cramerVFit(Before)

After = c(7, 9, 7, 7)

cramerVFit(After)

### Cramer V 
###  0.06667 
$\endgroup$
0

Your Answer

By clicking “Post Your Answer”, you agree to our terms of service and acknowledge you have read our privacy policy.

Not the answer you're looking for? Browse other questions tagged or ask your own question.