3
$\begingroup$

The common case for a Monte Carlo simulation is, if we want to run our simulation for $N$ steps, we define a delta $\Delta,$ such that $N/\Delta = n$ tells us the frequency with which we measure/evaluate quantities of interest during the MC run. For instance, say $N=1000,$ and we want to measure the average of an observable $f,$ after each $n=100$ steps (so here $\Delta=10$). The average is obtained by dividing $f$ by the number of times $f$ has been measured. This is linearly sampling the time or MC steps and the simulation looks schematically like (writing in python style):

interval = N/delta
f = 0
countmeasurement = 0
for mcstep in range(1,N):
  interval -= 1
  .
  .
  .
  if interval == 0:
    f += computef()
    .
    .
    interval = N/delta
    countmeasurement += 1
  #save or print
  print "steps ", mcstep, "average f ", f/countmeasurement 

Question:

With this scheme as sketched above, if later we plot $f$ as a function of MC-steps, on a log-log scaled plot, we will not have sampled the same amount of datapoints for each time scale as we sampled the total steps only linearly. How do we alter our sampling scheme, thus redefining interval, such that we gather the same number of datapoints for $f$ for each part (time-scale) of the log-log plot? Is it common to sample the MC-steps logarithmically in Monte Carlo simulations?

$\endgroup$
4
  • 1
    $\begingroup$ Why would you want to do this? I've never heard of sampling MC-steps logarithmically before, myself :) $\endgroup$
    – jbowman
    Commented Dec 18, 2017 at 23:02
  • 1
    $\begingroup$ @jbowman hi, indeed it is less common. One example where it s needed: for instance when trying to detect a power law behavior, at different time scales of a system, then your go-to approach is to compute the ave of that quantity at some interval during the MC, and then plot the log derivative plot of it vs log of MC, the slope of this plot gives you the power of the governing power law. But then here's the problem, how to sample such that at each time scale I have a consistent number of data points used to detect the power law. I hope this gives a general overview of why it may be needed. $\endgroup$
    – user929304
    Commented Dec 19, 2017 at 11:21
  • $\begingroup$ Yes it does, and very interesting too! $\endgroup$
    – jbowman
    Commented Dec 19, 2017 at 14:41
  • $\begingroup$ I have to say, your code isn't quite detailed enough to be clear to me, but wouldn't setting interval = N*mcstep/delta or some such (even interval = 10*mcstep) in the next-to-last line inside the if interval==0: clause do the trick? This suggestion is more meant so you can tell me why not, which will help clarify my understanding. $\endgroup$
    – jbowman
    Commented Dec 20, 2017 at 19:45

1 Answer 1

3
$\begingroup$

If I've understood the question correctly -

What you have to do is construct the step values of your simulation to be evenly distributed on a log scale, then exponentiate the step values for use in the relevant function. The differences between the step values, when plotted on a log-log graph, will be equal.

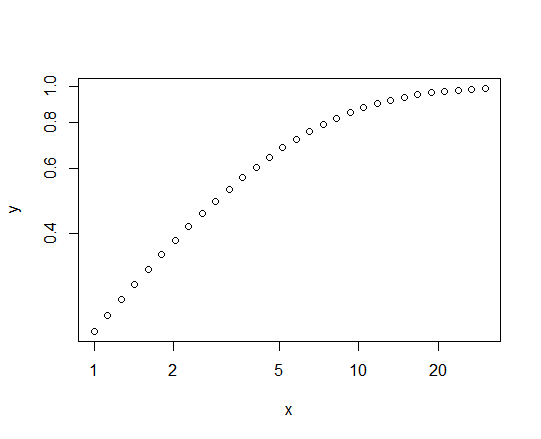
For example, consider plotting the cumulative density function of a Pareto (power law) variate as a highly simplified version of this. We set the mean and scale equal to 5, and plot the CDF for values of $x = 1, \dots, 30$:

ub <- 30
x <- 1:ub
y <- ppareto(x, m=5, s=5)
plot(y~x, log="xy")

which gives us the following graph:

enter image description here

This shows the unequal scaling referred to in the OP, admittedly in a different context, and how we lose a lot of information about the shape of the curve at values of the CDF below about 0.7 (i.e., most of it.)

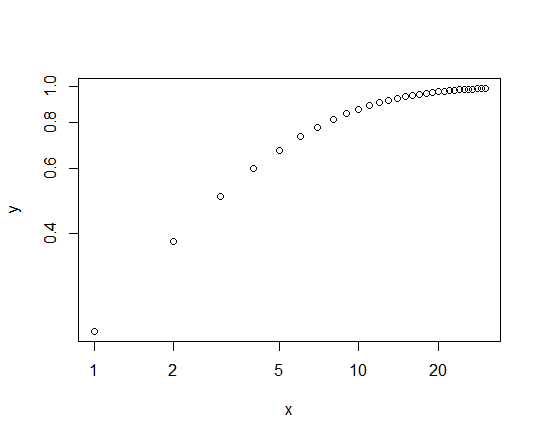
Altering the stepsizes of $x$ to be equal on the log scale fixes the problem:

log_ub <- log(30)
x <- exp(seq(from=0, to=log_ub, length.out=30))
y <- ppareto(x, m=5, s=5)
plot(y~x, log="xy")

The $x$ values cover the same range in the two cases - $(1,30)$ - but are distributed more informatively in the second case:

enter image description here

In certain contexts, the "step sizes" referred to above are the number of iterations some sub-task is performed at each master step of the simulation. The procedure in those cases would have to be adjusted so as to generate integer values for the number of iterations, but for any significant number of iterations, just rounding off would be sufficient.

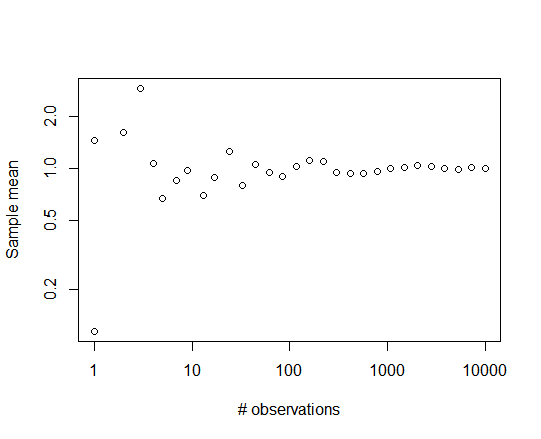
For example, sampling from a Pareto distribution with different sample sizes ranging from 1 to 10,000:

log_ub <- log(10000)
y <- rep(0,30)
x <- round(exp(seq(from=0, to=log_ub, length.out=30)))
for (i in 1:30) y[i] <- mean(rpareto(x[i], 1, 5))
plot(y~x, log="xy", xlab="# observations", ylab="Sample mean")

yields the following plot:

enter image description here

$\endgroup$
8
  • $\begingroup$ Dear jbowman, this is exactly what I was looking for, thank you very much for taking the time to write this up. Are the sample codes in R? What does seq do here? $\endgroup$
    – user929304
    Commented Dec 28, 2017 at 17:32
  • $\begingroup$ Yes, they are in R. seq basically just creates a vector of equally-spaced numbers starting with from, ending with to, and with length.out entries in it. So, seq(from=0, to=1.5, length.out=4) would create (0, 0.5, 1.0, 1.5). To add some possibly-useful information, rpareto creates random numbers ~ Pareto, with the first parameter (x[i]) being the number of them created - so you could think of that function call as being x[i] executions of the underlying simulation, with mean(.) as being the function that aggregates the x[i] simulation results. $\endgroup$
    – jbowman
    Commented Dec 28, 2017 at 18:07
  • $\begingroup$ I am still a bit struggling in my attempt. I m writing the routine in c++, in your case the max value is 10000, and to sample you re linearly picking values between 0 to log(10000), and then you exponentiate the values so they range from 1 to 10000 again but logarithmically separated now. Right? My way of implementing your seq function has been to set logmax = log(10000);, interval=logmax/30; and then for (int i=0; i<30; i++){ x[i]=round(exp(i*interval)); } is this a correct way of recreating basically what you had shown in R? Many thanks for your help in advance $\endgroup$
    – user929304
    Commented Jan 7, 2018 at 20:35
  • $\begingroup$ That looks right to me, with the caveat that the maximum i you have is 29, so your maximum x[i] will be exp(29*logmax/30), not exp(logmax). This is because you need n+1 steps to get both the endpoints of the interval [lower, upper], so i <= 30 would do the job. Otherwise, if you want 30 values, you need interval = logmax/29;. $\endgroup$
    – jbowman
    Commented Jan 7, 2018 at 21:09
  • $\begingroup$ Well, I'd just eliminate the duplicate values myself, leaving you with one copy of each value. $\endgroup$
    – jbowman
    Commented Jan 7, 2018 at 21:34

Your Answer

By clicking “Post Your Answer”, you agree to our terms of service and acknowledge you have read our privacy policy.

Not the answer you're looking for? Browse other questions tagged or ask your own question.