I have recently completed a course on Machine Learning and am now attempting to apply my knowledge by creating a neural network that attempts to, given a series of $n$ candlesticks (stock market data), predict what the next candlestick might be. I have over 1 million candlesticks available as a training set.
Each candle contains five variables that help shape it: Open Price, High, Low, Close Price, and Volume. In addition to the $n$ candlesticks I feed the network, my goal is to have it output a candle with these same variables filled in. How can I best approach this?
Let's assume I set up the network to make a prediction based on $n=10$ previous candles. Would I be required to have $10*5=50$ input neurons, five for each variable spanning a total of $10$ candles? In class we made simple 2-input, 1-output networks and didn't spend much time on creating an optimal network layout, so using that many features seems like a foreign concept to me.
It also raises the question of efficiency. If I train with backpropagation, which is very computationally expensive, I feel like having a total of $50$ input features would be very inefficient to train, especially considering the size of my training set (and this issue would likely persist even if I set aside 20% for cross-validation). Would it then be slightly more optimal to have separate networks for each variable, so that each network has only $10$ inputs and one output?
Edit: For a bit more clarity, here's an explaination of a candlestick.
Say I'm looking at the 1-minute candle chart. This means that each candle on the graph represents one minute of stock price history. As soon as a minute passes, a new candle is created representing the new minute, and it's open value is whatever the last traded price was. So if the last trade was for \$150, the "open" for this candle is \$150.
Then lets say 10 trades take place that drive the price down to \$140. \$140 is so far the lowest price point for this minute/candle, so the open stays \$150, the high stays \$150, the volume increases by however many shares were traded, and the low is set to \$140. The candle is red because the current price is now below the open price.
Then, let's say another 10 trades occur and drive the price up to \$160. Now the high is \$160, the low is still \$140, the open is \$150, and the volume has yet again increased by however many shares were traded. Now that the current price is above the open price, the candle is green, and there is a thin line on the bottom of the candle showing that the price dipped to that point, but recovered.
Now 12:02 rolls by, and the candle closes at \$155. There are thin lines on both the top and the bottom representing where the price had been in that timeframe, and the solid body of the candle represents where it opened and closed at.
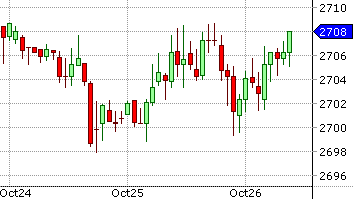
Here's a picture of what it might look like:
Granted, this is a 1-day candle chart, so each candle represents the passage of 24 hours. And as an example, the very first candle is red, so we can assume that it started close to 2708, dipped down to 2705ish, and recovered to 2707 before the candle closed and a new day started

