1
$\begingroup$

I am trying to understand the benefits of transformation functions. Mainly, I am trying to understand the kick / the motivation to even attempt a transformation function on a sample data being analyzed. So, below I have 2 scatter plots of the same dataset.

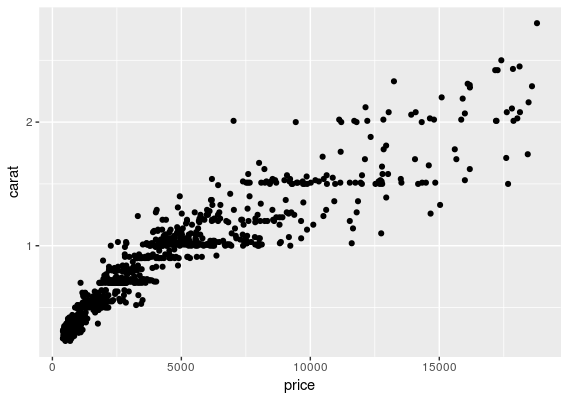
The first plot is carat v/s price:

enter image description here

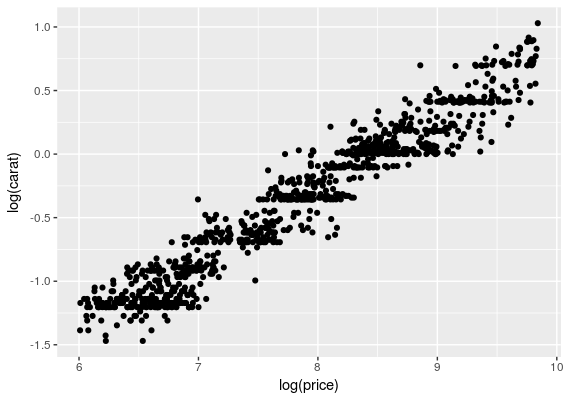
The second plots is log(carat) v/s log(price):

enter image description here

Yeah, it is true that the second plot gives a more straight line as compared to the first scatter plot. But can we deduce something here? Could you give an example/case where the second graph could be useful? One thing that shadows my approach towards transformation is that, why would anyone want to study log(carat) vs log(price), when in real life, carat and price occur?

$\endgroup$
6
  • 2
    $\begingroup$ In this case, I think the opposite view is more plausible, namely that price is predicted by carat, although it's possible that you want to guess carat from price. That said, the transformation approach leads clearly here to (a) the idea that a power function is a plausible functional form and (b) (less important but often mentioned first) the perception that variability of outcome given predictor is simpler in the transformed space. People often do look directly at untransformed data, but you need more experience and statistical knowledge to know what to fit and how to fit it well. $\endgroup$
    – Nick Cox
    Commented Feb 13, 2018 at 18:20
  • 2
    $\begingroup$ In short, you can (and often should) back-transform to present results. $\endgroup$
    – Nick Cox
    Commented Feb 13, 2018 at 18:21
  • $\begingroup$ A related discussion: stats.stackexchange.com/questions/18844/… $\endgroup$
    – Stefan
    Commented Feb 13, 2018 at 18:22
  • $\begingroup$ For one thing, it just makes the mathematics easier. You can fit a line to the data in the second plot. Of course, when you transform back, that line is no longer a line but a curve---but estimating the parameters of it as a line are easier than estimating the parameters of it as a curve. For e.g., note all the methods in statistics that involve shifting and scaling to zero mean and unit variance. Sure, you could not transform, and instead introduce parameters that account for the different mean and variance...but it's just easier to shift/scale, and remember smaller formulas. $\endgroup$
    – alkasm
    Commented Feb 13, 2018 at 18:41
  • 3
    $\begingroup$ It's hard to do justice to this topic within the limited space in this forum. I have made available a detailed account at quantdec.com/misc/MAT8406/Meeting07/Diagnostic_Plots.pdf. As examples it analyzes two datasets: points per game made by 267 NBA players in 2015 (pp 1-8) and height/weight data from the NHANES National Youth Fitness Survey (2012) (pp 9-24). The latter dataset is qualitatively like your illustration. Using standard EDA techniques to identify suitable transforms, the final regression fits an unusual nonlinear model and finds it to be a beautiful fit. $\endgroup$
    – whuber
    Commented Feb 13, 2018 at 18:44

0

Browse other questions tagged or ask your own question.