I am using an analysis for an experiment that I consider suboptimal. I am asking for any suggestions to improve this. I will briefly outline the experiment and what I’ve done, then ask your advice.
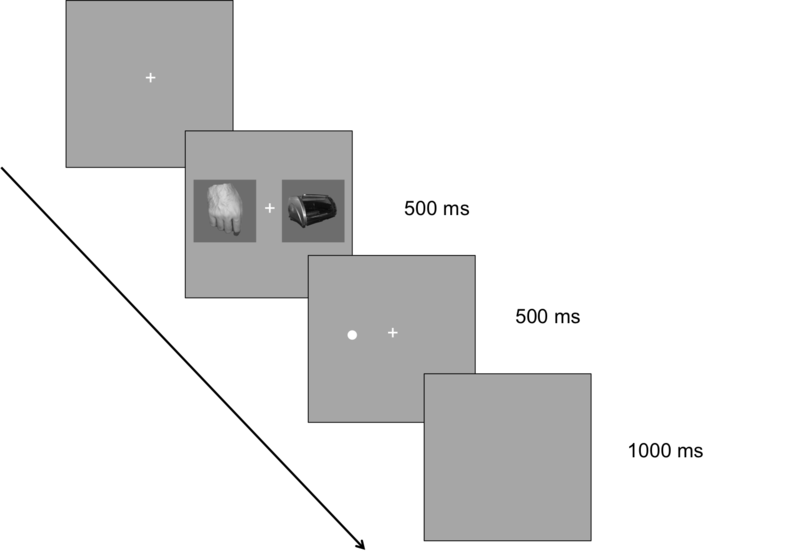
The experiment is a two-alternative forced-choice task. Participants view two images side by side. Immediately following, a probe dot occurs on either the left or the right. Participants respond as quickly as possible, indicating which side the probe was on. You can view an image of the trial structure here.

The underlying assumption is that if one of the images draws the participant’s attention, they should be faster to respond to a probe dot on that side of the screen.
There are 4 categories of images with 9 exemplars each, in this example, hand tools, hands, sea stars, and toasters. All 12 possible permutations of images categories are represented (not including comparisons of a category with itself). Thus, hands on the left are paired with hand tools, sea stars and toasters on the right and the same pairings for hands on the right. And so on for all categories.
You can view what the data would look like using the following R code.
reactionTime<-rnorm(2400, mean = 330, sd = 100)
participant<-rep(1:20, each = 120)
toaster<-rep(c(rep("L",3), rep("R",3), rep(NA,6)),200)
handTool<-rep(c("R",NA,NA,"L",NA,NA,"R","R","L","L",NA,NA),200)
hand<-rep(c(NA,"R",NA,NA,"L",NA,"L",NA,"R",NA,"R","L"),200)
seastar<-rep(c(NA,NA,"R", NA,NA, "L",NA,"L",NA, "R","L","R"),200)
probe<-rep(c(rep("L",12), rep("R",12)),100)
handedness<-rnorm(2400, 50, 10)
data<-as.data.frame(cbind(participant,toaster,handTool,hand,seastar,probe,reactionTime,handedness))
I have treated each image category as a factor, with the levels Left, Right or NA, with NA indicating that the image is not one if the two displayed. The probe factor indicates the side of the screen the prove dot occurs on. Participant is the participant number and a handedness measure is used as a covariate.
The question of interest is this: are participants faster when a hand is coincident with the probe dot, irrespective of the other image?
Thus far, I have analyzed this data using a 2 (image category, L or R) x 2 (Probe location, L or R) linear mixed-model using handedness as a covariate and treating participants as a random factor. I have had to do 4 separate models, using a subset of the data for each of the image categories, due to the NAs within the factors. R code example is below.
require(“nlme”)
lme.hand<-lme(RT ~ hand * probe + handedness, data=subset(data, is.na(data$hand) == FALSE),
              random = ~1 | participant)
anova(lme.hand, type="marginal")
I have 2 questions:
Can anyone think of a more elegant solution to this problem, either by reorganizing the data or selecting an alternate model?
If not, how would be an appropriate confidence interval be calculated for the fixed effect?
