16
$\begingroup$

Recently I got mix response on the difference between multivariate time series data and panel data. I completely understand the difference between cross sectional data, time series data and panel data. But sometimes it becomes difficult to distinguish between panel data and multivariate time series data.

For example, if we consider data on daily closing prices for last one year for 10 companies. Is it panel data or just multivariate time series data? I found such type of data categorised as multivariate time series in time series books, whereas some econometrics book categorised such type of data as panel data.

How can we statistically categorised data between multivariate time series and panel data?

$\endgroup$
5
  • 1
    $\begingroup$ In time series data, the serial or carry-over effect is always assumed for each series: x(t) is dependent on x(t-1). Time series thus is seen as a developmental process with intrinsic heritage in each subject (series) under the study. Panel data by default do not assume the serial effect; some analytical procedures of such data even state there must be no any carry-over. And if there should be one, it is modeled as an external, applied factor which is typically not subject-specific in parameters. $\endgroup$
    – ttnphns
    Commented Jun 11, 2019 at 6:07
  • $\begingroup$ The second difference pertains to the "multivariate", as you call it, situation. Say, you have two 2 companies (A,B) and 3 days of observation of their prices (t1,t2,t3). In panel (aka repeated measures) analysis the dataset is either 2 rows (companies) x 3 cols (times) - the wide format, or 6 x 1 - the long format. That means the two companies are (by default) are seen as two independent subjects. But in the two-series time series analysis the data will look as 3 rows (times, with carry over effect) x 2 cols (companies), and the companies are seen as potentially correlating variables. $\endgroup$
    – ttnphns
    Commented Jun 11, 2019 at 6:29
  • $\begingroup$ @ttnphns thank you for your response. It means it is correlation between the cross sectional units distinguish between panel data and multivariate time series. It means if there is no correlation between the two time series (as you mentioned) then it will become panel and if in panel data someone assume correlation between cross sectional units then panel will become multivariate time series data. Is it right? $\endgroup$
    – Neeraj
    Commented Jun 11, 2019 at 6:43
  • $\begingroup$ Well, I personally see it this way. If your two companies (A, B) are two processes so that the following influence is assumed true: A(t) depends on A(t-1) (and so for B) (autocorrelation), - I would call it "time series". Then, if additionally to assume: either A(t) depends on B(t) (correlation), or A(t) depends on B(t-1) (lagged correlation), - then I would call the time series "multivariate" (in the sense "two interrelated time series"). $\endgroup$
    – ttnphns
    Commented Jun 11, 2019 at 7:11
  • $\begingroup$ Nothing of these is assumed by default in panel data, where A and B are seen as two independent study units (usually randomly selected from their population or populations) each observed at different time follow-ups. $\endgroup$
    – ttnphns
    Commented Jun 11, 2019 at 7:11

1 Answer 1

11
$\begingroup$

In short, there is no such thing as Multivariate Time Series data. The only classic data types out there are: Cross Sections, Time Series, Pooled Cross Sections, and Panel data.

Panel data is multidimensional. Time series is one-dimensional. Time Series data is a type of panel data. Daily closing prices for last one year for 1 company is a Time Series dataset because the time variable alone uniquely identifies each observation. I will work with only 8 days worth of prices instead of a year, but the idea is the same.
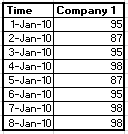
enter image description here

Daily closing prices for last one year for 10 companies can be both a Panel dataset and a Time Series dataset, depending on whether it is in wide or long format.

If the data is organized so that Time still uniquely identifies each observation (i.e. wide format) then it is still a time series dataset, and you will have different columns for the daily closing price for each of the 10 companies. See example below:

enter image description here

If, on the other hand, it is organized so that Time alone no longer uniquely identifies each observation (i.e. long format) then it is a panel dataset. With 10 companies, you need to use Time and Company ID together to uniquely identify each observation. See example below:
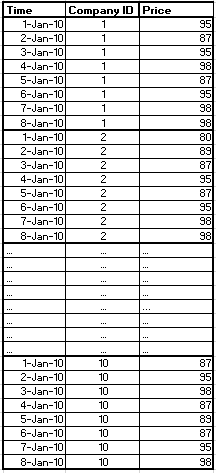
enter image description here

In any statistical software it is straightforward to reshape a dataset from wide to long and from long to wide.

The term Multivariate Time Series is heard around, but it refers not to a type of dataset but to a type of analysis. To be more exact, it refers to the type of time series regression analysis in which there is more than one response variable. (Make sure to distinguish it from Multiple Time Series regression, which refers to a regression with one response variable and several predictor variables). One example of Multivariate Time Series Analysis is VAR (Vector AutoRegression).

enter image description here

More on VAR here: https://en.wikipedia.org/wiki/Vector_autoregression

I hope this helps.

$\endgroup$
1
  • $\begingroup$ Very clearly written and memorable explanation! $\endgroup$ Commented Aug 18, 2022 at 14:54

Your Answer

By clicking “Post Your Answer”, you agree to our terms of service and acknowledge you have read our privacy policy.

Not the answer you're looking for? Browse other questions tagged or ask your own question.