18
$\begingroup$

I have two groups of subjects, A, and B, each with a size of approximately 400, and about 300 predictors. My goal is to build a prediction model for a binary response variable. My customer wants to see the result of applying the model built from A on B. (In his book, "Regression Modelling Strategies", @FrankHarrell mentions that it's better to combine the two datasets and build a model on that, since doing so adds power and precision --- see page 90, External Validation. I tend to agree with him, considering that collecting the type of data that I have is very expensive and time consuming. But I don't have a choice about what the customer wants.) Many of my predictors are highly correlated and also very skewed. I'm using logistic regression to build my predictive model.

My predictors come mainly from mechanics. For example, total time the subject was under a stress higher than threshold $\alpha$ for time period $[t_1, t_2]$, for various values of $\alpha > 0$ and $0 \leq t_1 < t_2$. It is clear that just from their definitions, many of these total times are algebraically related to each other. Many of the predictors that are not algebraically related are related because of their nature: subjects that are under high stress during a time period $[t_1, t_2]$ tend to be under high stress during time period $[t_3,t_4]$, even if $[t_1,t_2] \cap [t_3,t_4] = \emptyset$. To reduce the dimension of the data, I clustered related predictors together (for instance, all the total stress times together) and used principal component analysis to represent each cluster. Since the variables were skewed, I tried two alternative paths:

  • Before doing the PCA, I used a logarithmic transformation to reduce the skew in variables.
  • I used Mia Hubert's ROBPCA algorithm, as implemented by the package rrcov in R, (PcaHubert), to find the robust principal components.

I am using the overall shape of the ROC curve, the shape of the precision-recall curve, and the area under the ROC curve (AUC) as my performance measures, and I'd like to get similar results for both datasets A and B. I was expecting to get a much better result from using the robust principal components, but to my surprise, the first method did better: better AUC value for both datasets A and B, more similarity between ROC curves, and more similar precision-recall curves.

What is the explanation for this? And how can I use robust principal components, instead of trying to make my data look like normal? Are there any particular robust PCA methods that you'd recommend instead of ROBPCA?

$\endgroup$
5
  • $\begingroup$ " I clustered related predictors together " can you explain better what steps that involves? "I was expecting to get a much better result from using the robust principal components" Can you explain how you measure results? $\endgroup$
    – user603
    Commented Aug 2, 2012 at 8:27
  • $\begingroup$ Why do you think it is better to combine the datasets? I don't agree at all. One difficulty that this sort of problem has is relying too much on the particular data. Testing the model on another data set is a good idea. $\endgroup$
    – Peter Flom
    Commented Aug 2, 2012 at 10:13
  • $\begingroup$ In what sense was the regular PCA on the log variables "better"? Did it make more intuitive sense? Did it give a better result in the second data set? $\endgroup$
    – Peter Flom
    Commented Aug 2, 2012 at 10:14
  • $\begingroup$ Thank you @PeterFlom for your comments! I've updated the question per your comments. $\endgroup$
    – user765195
    Commented Aug 3, 2012 at 3:37
  • $\begingroup$ Thank you @user603 for your comment! I've updated the question to reflect your comment. $\endgroup$
    – user765195
    Commented Aug 3, 2012 at 3:38

1 Answer 1

18
$\begingroup$

In short, and from your description, you are comparing apple to oranges....in two ways.

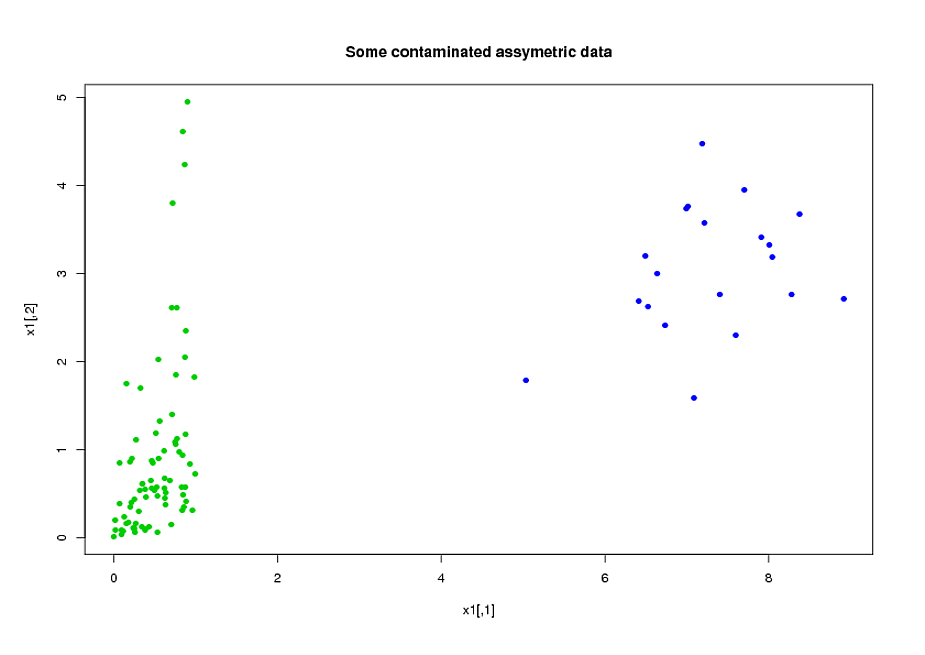
Let me address the first comparability issue briefly. The log transform does not address the outlier problem. However, it can help making heavily skewed data more symmetric, potentially improving the fit of any PCA method. In short, taking the $\log$ of your data is not a substitute for doing robust analysis and in some cases (skewed data) can well be a complement. To set aside this first confounder, for the rest of this post, I use the log transformed version of some asymmetric bi-variate data.

Consider this example:

library("MASS")
library("copula")
library("rrcov")
p<-2;n<-100;

eps<-0.2
l1<-list()
l3<-list(rate=1)
#generate assymetric data
model<-mvdc(claytonCopula(1,dim=p),c("unif","exp"),list(l1,l3));
x1<-rMvdc(ceiling(n*(1-eps)),model);
#adding 20% of outliers at the end:
x1<-rbind(x1,mvrnorm(n-ceiling(n*(1-eps)),c(7,3),1/2*diag(2))) 

data

Now, fit the two models (ROBPCA and classic pca both on the log of the data):

x2<-log(x1)
v0<-PcaClassic(x2)
v1<-PcaHubert(x2,mcd=FALSE,k=2)

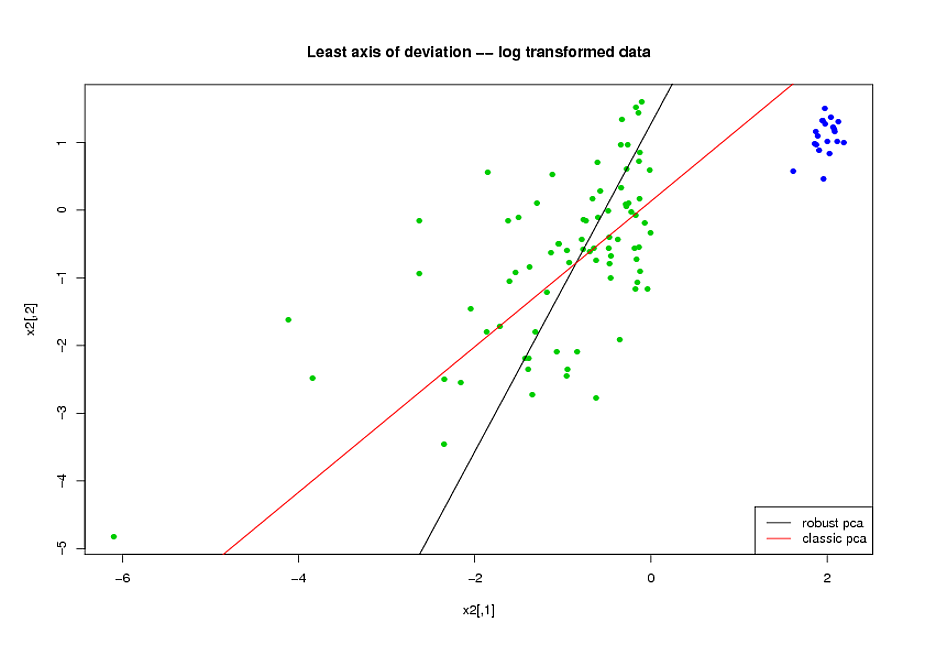
Now, consider the axis of smallest variation found by each method (here, for convenience, i plot it on the log-transformed space but you would get the same conclusions on the original space).

model

Visibly, ROBPCA does a better job of handling the uncontaminated part of the data (the green dots):

But now, I get to my second point.

--calling $H_u$ the set of all green dots and $z_i$ ($w_i$) the robust (classical) pca score wrt to the axis of least variation --

you have that (this is quiet visible in the plot above):

$$\sum_{i\in H_u}(z_i)^2<\sum_{i\in H_u}(w_i)^2\;\;\;(1)$$

But you seem to be surprised that:

$$\sum_{i=1}^n(z_i)^2>\sum_{i=1}^n(w_i)^2\;\;\;(2)$$

--the way you described your testing procedure, you compute the fit assessment criterion on the whole dataset, so your evaluation criterion is a monotonous function of (2) where you should use a monotonous function of (1)--

In other words, do not expect a robust fit to have smaller sum of squared orthogonal residuals than a non robust procedure on your full dataset: the non robust estimator is already the unique minimizer of the SSOR on the full dataset.

$\endgroup$
1
  • 2
    $\begingroup$ Thank you for your response. It took me a while to experiment with other data and think about your response to really understand it. $\endgroup$
    – user765195
    Commented Sep 25, 2012 at 3:42

Your Answer

By clicking “Post Your Answer”, you agree to our terms of service and acknowledge you have read our privacy policy.

Not the answer you're looking for? Browse other questions tagged or ask your own question.