2
$\begingroup$

If we have a covariance matrix $A$

$AP=PD$

where $D$ is a diagonal matrix which contains all the eigenvalues

then if the variance of the eigenvalues is very small, what does this tell us about $A$?

Intuitively, I think this tells us that the distribution of raw data is like a circle (in a 2-d sense) rather than an oval

Is there any other insight we can discover by looking at how the eigenvalues are distributed?

$\endgroup$
1
  • $\begingroup$ As per the answer of user20160, I think I lay the question in a wrong way. The "variance of eigenvalue " is not a good term. What I want to ask is the 'relative magnitude of the absolute value of eigenvalues' $\endgroup$
    – user152503
    Commented Apr 1, 2018 at 9:15

3 Answers 3

7
$\begingroup$

Each eigenvalue indicates the variance of the data along the direction of the corresponding eigenvector.

If the data are jointly Gaussian, then the covariance matrix completely determines the shape of the distribution. In this case, similar eigenvalues indicate a distribution that's closer to spherical. Uneven eigenvalues indicate a more ellipsoidal distribution that's wider along directions corresponding bigger eigenvalues.

I'm assuming what you mean by "variance of eigenvalues" is $\frac{1}{d} \sum_{i=1}^d (\lambda_i - \bar{\lambda})^2$, given eigenvalues $\{\lambda_1, \dots, \lambda_d\}$ of a particular covariance matrix, with average $\bar{\lambda}$. This doesn't say much about shape. For example, consider covariance matrix $C_1$ with eigenvalues $[1, .01, .01]$. This corresponds to an elongated Gaussian with variance 100 times greater along the principal direction. Now consider covariance matrix $C_2$ with eigenvalues $[100, 99.01, 99.01]$. The corresponding Gaussian is much closer to spherical, but the variance of the eigenvalues is identical for $C_1$ and $C_2$. The eigenvalues' relative magnitudes say more about shape than their variance.

Furthermore, if the data are non-Gaussian, the covariance matrix doesn't uniquely determine the shape of the distribution. Even though the eigenvalues tell us the variance along each direction, this may not be very informative about the shape of the distribution. For example, here are some datasets with unit variance in all directions (each covariance matrix has eigenvalues $[1, 1]$):
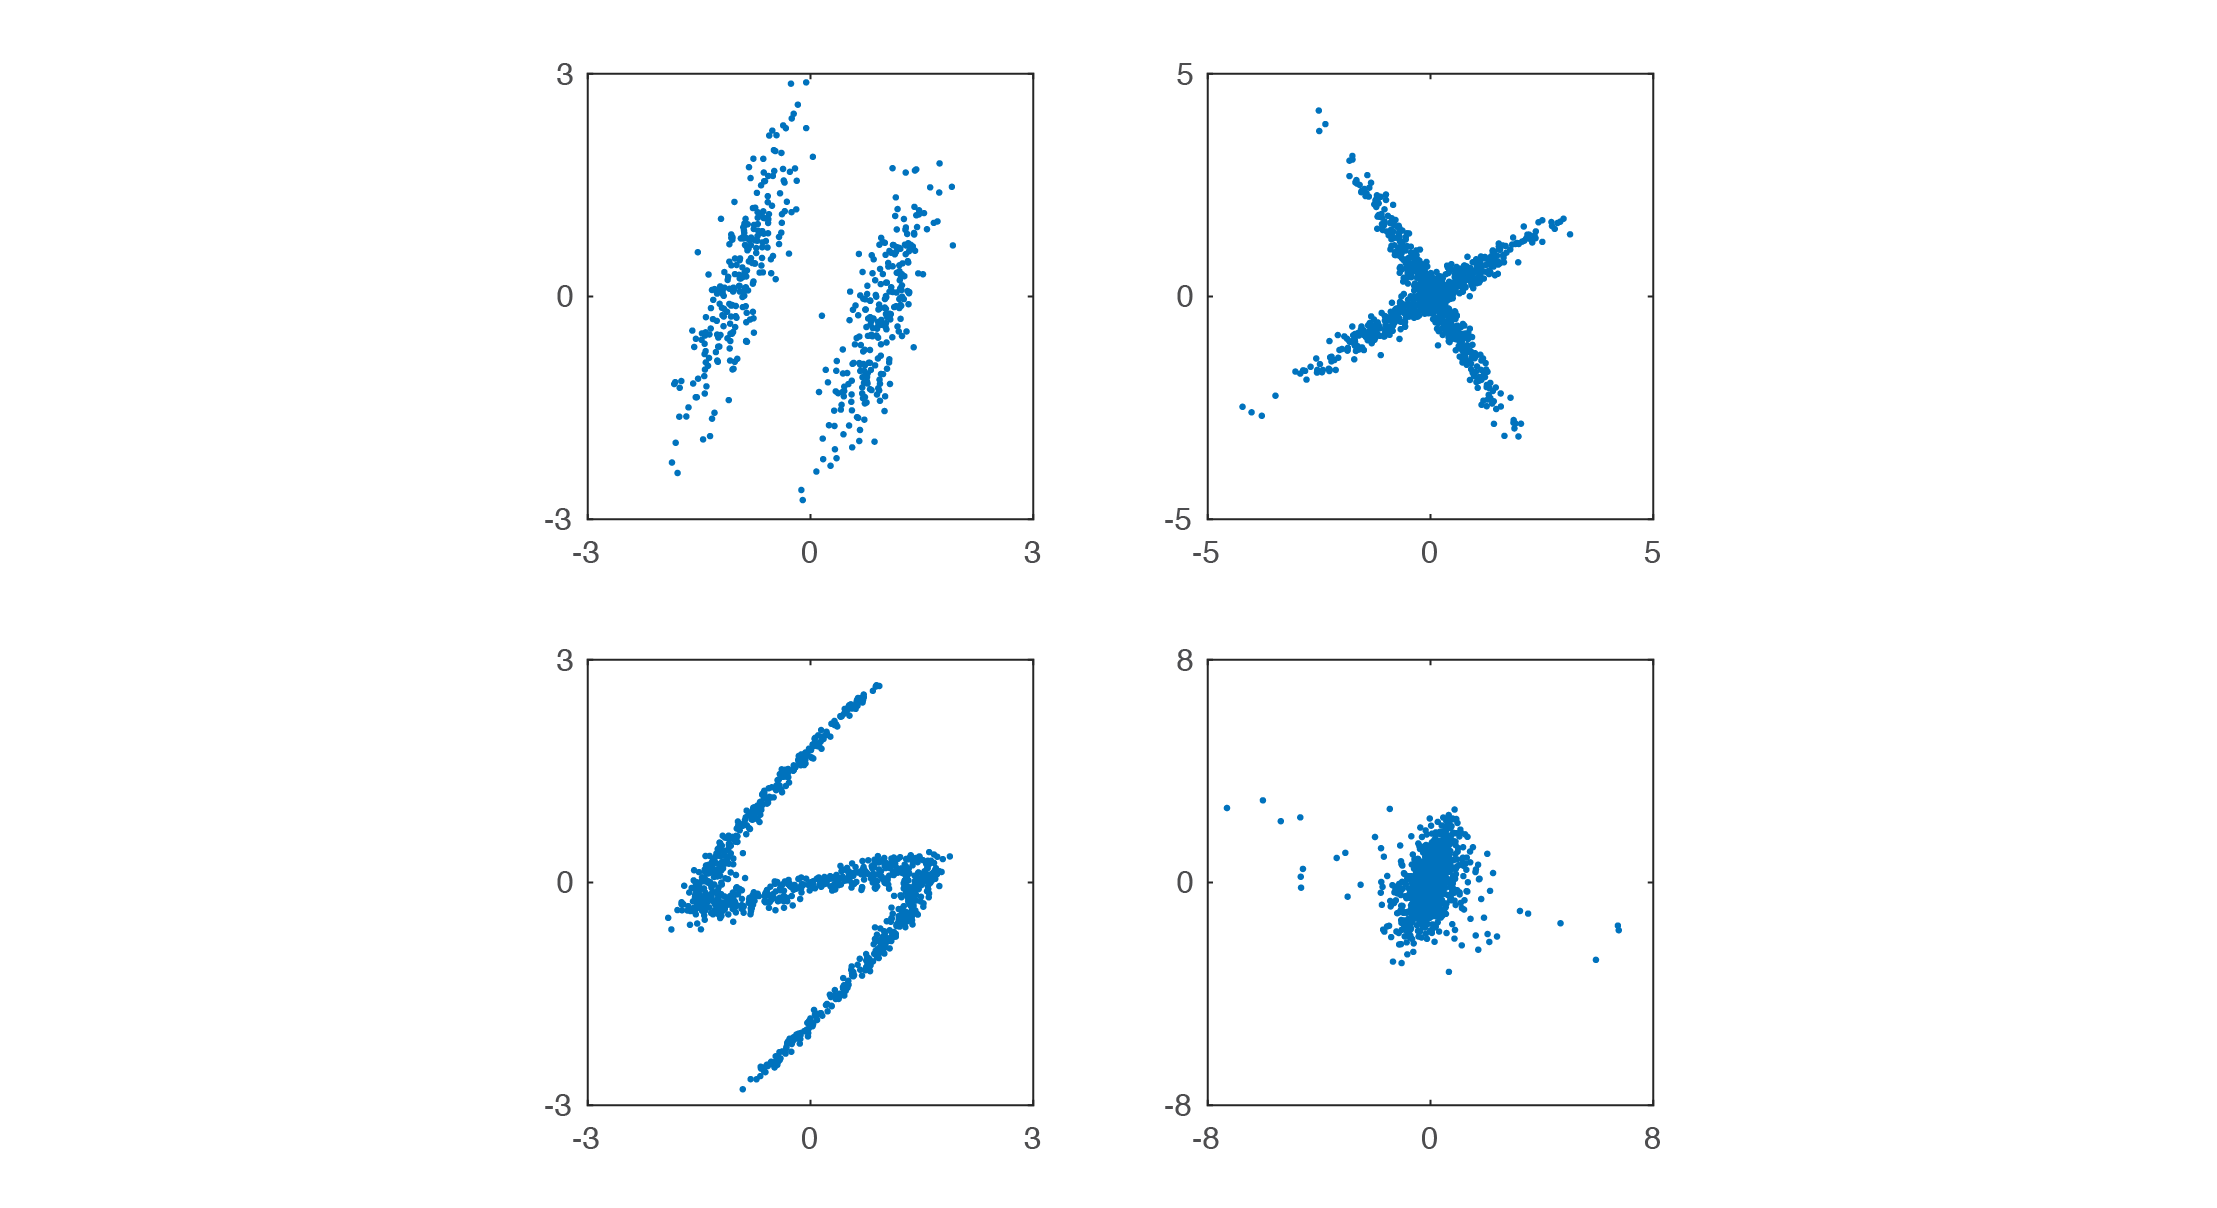
enter image description here

$\endgroup$
1
$\begingroup$

Extremely low variance in a principal component signals a constraint in the predictor variables.

For example if a principal component is a linear combination $x_1 + x_2$ and has very low variance, that signals high multi-collinearity $x_1 = -x_2$.

$\endgroup$
1
  • 2
    $\begingroup$ Could you elaborate on how you interpret the question? Your answer does not seem to address the question about covariance matrices with eigenvalues that don't vary much. $\endgroup$
    – whuber
    Commented Mar 31, 2018 at 17:43
1
$\begingroup$

Eigenvalues are the variance of principal components. If the eigen values are very low, that suggests there is little to no variance in the matrix, which means- there are chances of high collinearity in data. Think about it, if there were no collinearity, the variance would be somewhat high and could be explained by your model. If the covariance is 0, that means, what the first variable is trying to explain, the same the second variable is trying to explain. If thats the case, why keep 2 variables.

$\endgroup$

Your Answer

By clicking “Post Your Answer”, you agree to our terms of service and acknowledge you have read our privacy policy.

Not the answer you're looking for? Browse other questions tagged or ask your own question.