1
$\begingroup$

I posted the following question on Physics SE (here), but was told it might be better placed on Cross Validated.

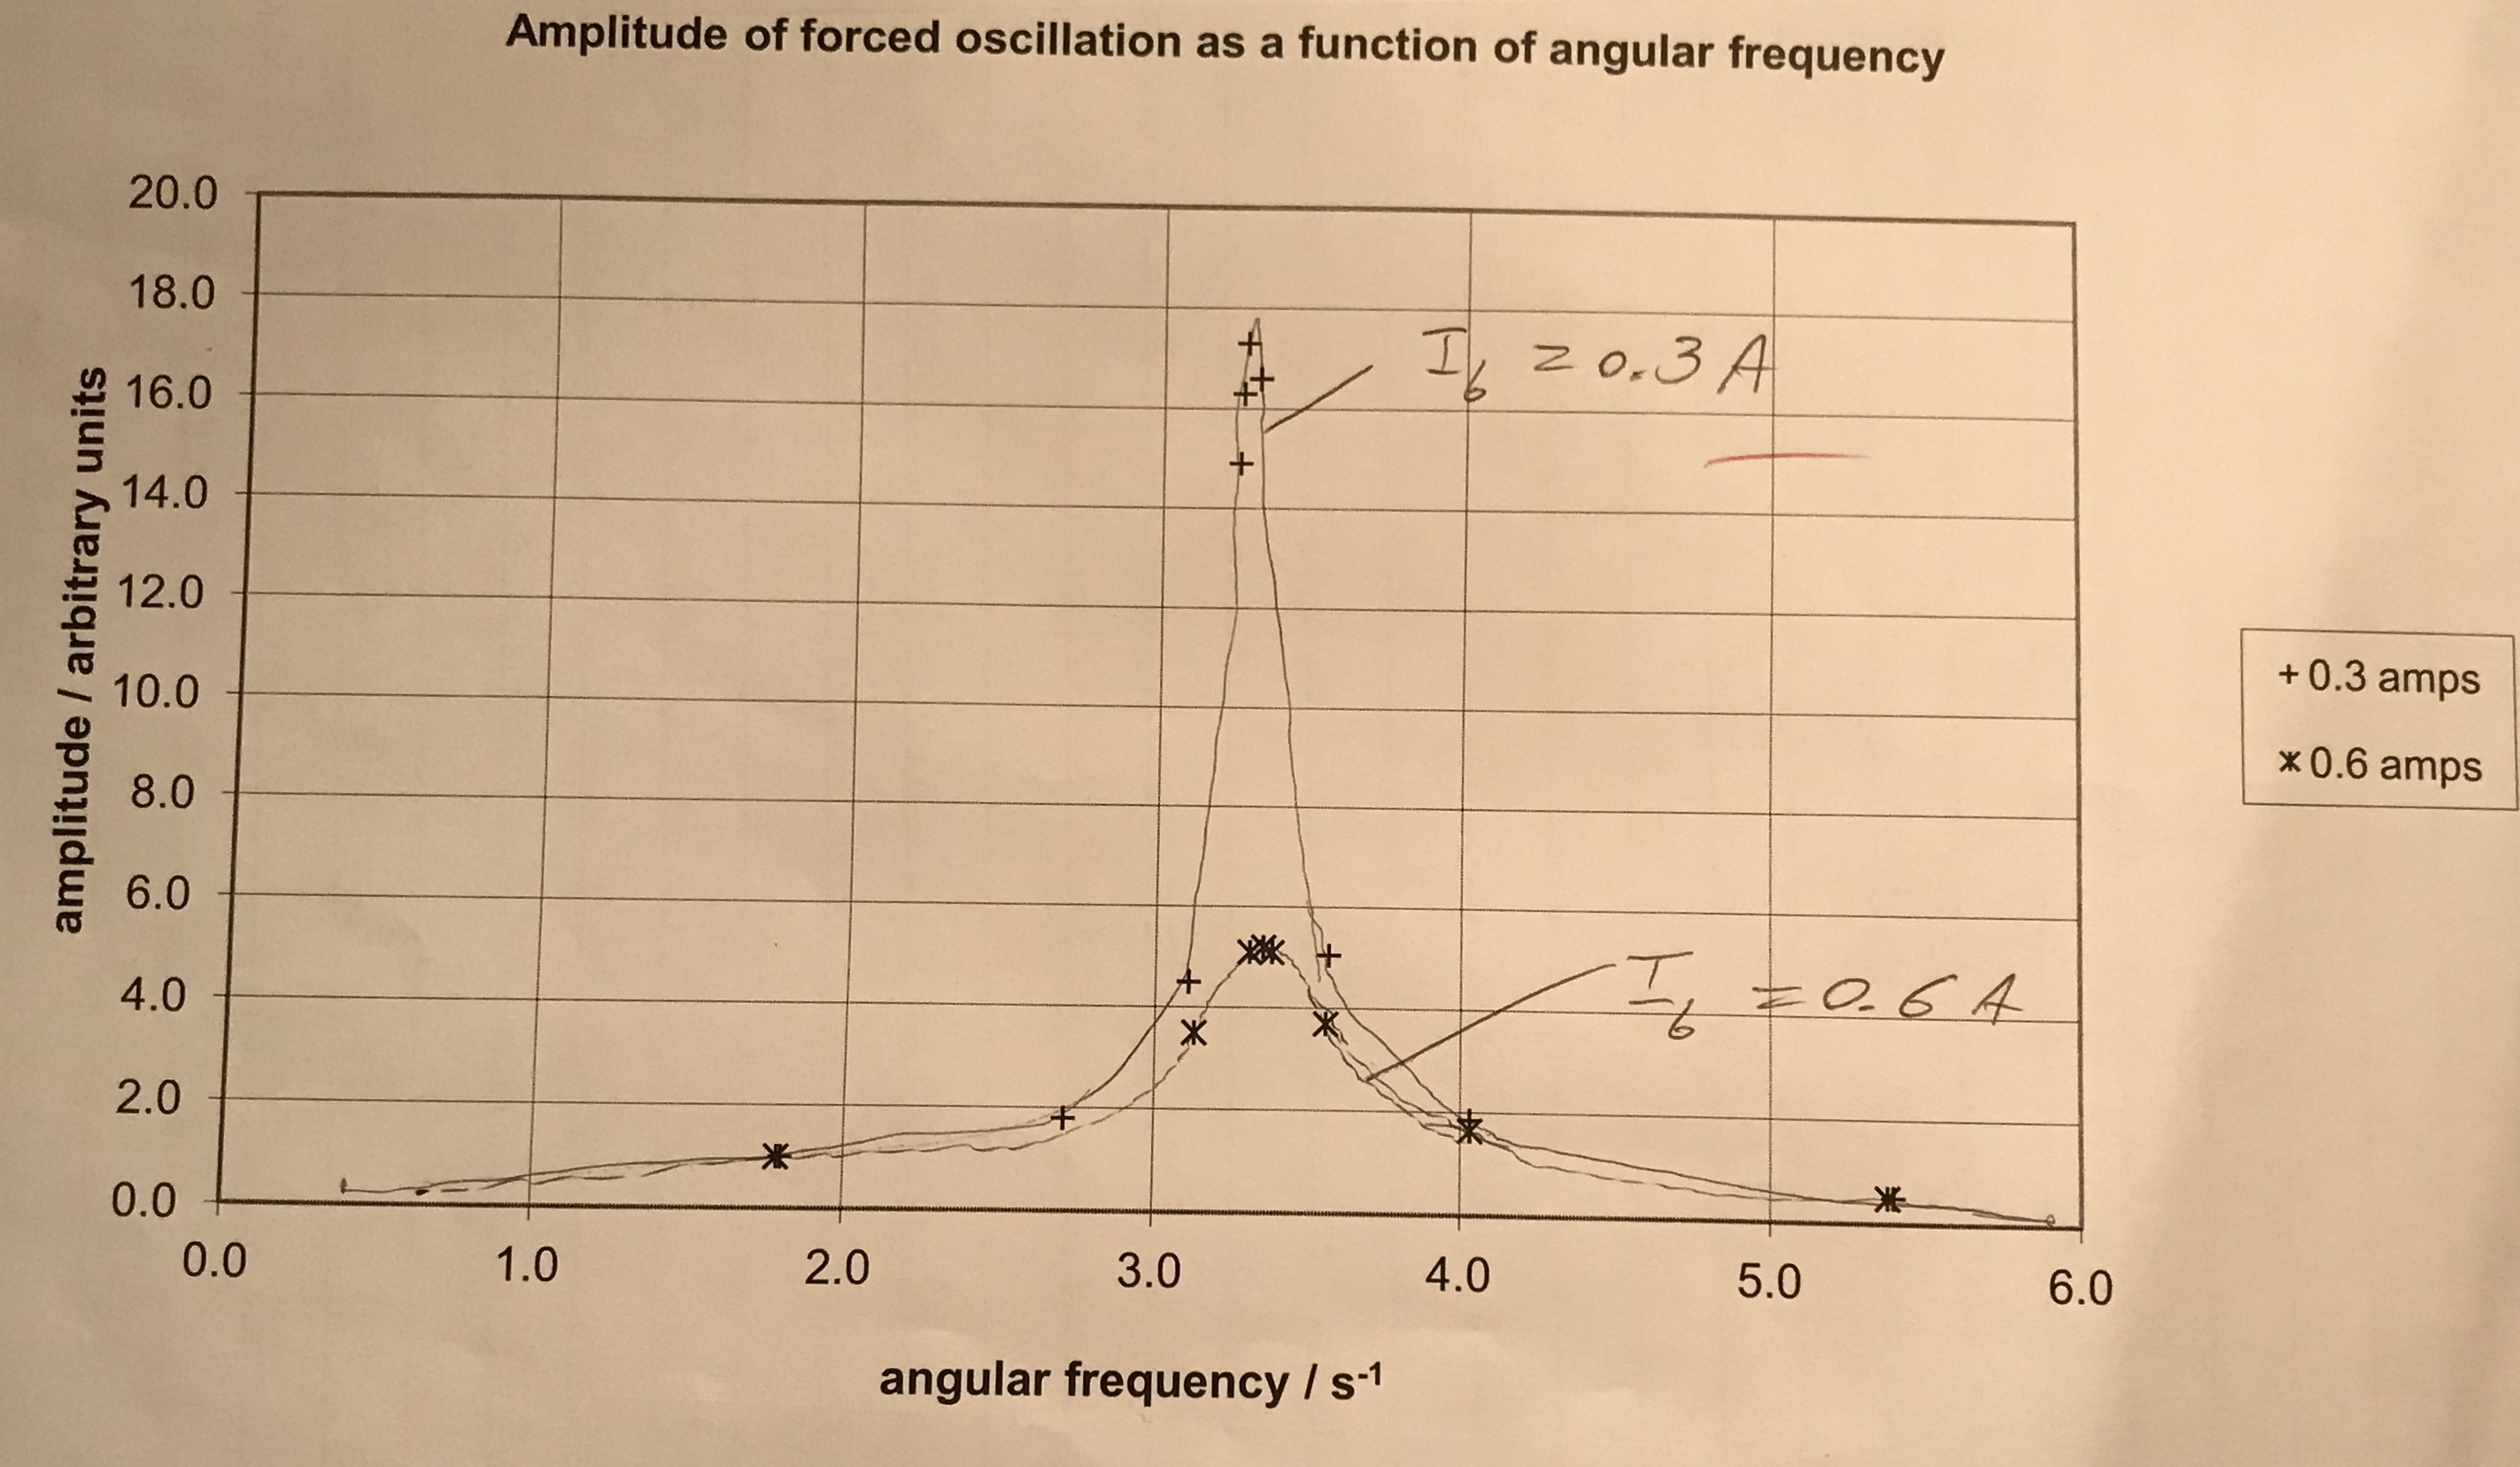
Alright, so I am not sure what terminology easily describes this, but I have an excel spreadsheet with data for plotting a graph, and I know that there is a maximum in this graph, and I am trying to estimate its position. So what I wonder is given the uncertainties in the measurements of frequency and amplitude in this case, how can I find the uncertainty in the position of the maximum? I could just use the point with the greatest amplitude, but we do not know whether or not a better maximum exists. I could say that assuming there is only one maximum (which we may do), I could use the points around the top maximum to create a range in which the maximum should lie, but then I still have no quantitative deciding on the uncertainty. I hope I am being sufficiently descriptive here, but I am not sure. I suppose another question is what we use as our best estimate for the maximising frequency anyways.

To be clear, I do have access to errors in all measured quantities on the graph.

graph

$\endgroup$
3
  • $\begingroup$ Perhaps the most critical aspect of the solution concerns whether the measurement errors in the angular frequency are independent. (Associated with this issue is consideration of the possibility of a systematic error in the angular frequency measurement.) The reason I focus on this is that the data appear to have been very well chosen for the purpose of identifying the peak, leaving little possibility of much estimation error. Would it be reasonable to adopt a standard model of peak shape, such as $A\Re((\omega-\omega_0)^{-1})$ for unknown complex $\omega_0$ and real $A$? $\endgroup$
    – whuber
    Commented Apr 14, 2018 at 17:49
  • $\begingroup$ Indeed errors in measurement are independent, and the graph was generated in real time to assist efficient identification of the peak. It is possible to apply a model to the peak, since we do have a theory for it (it is just a forced damped harmonic oscillator). But I am more interested in trying to verify the model rather than using it for accurate measurements, so a graphical approach would be helpful. $\endgroup$ Commented Apr 15, 2018 at 12:24
  • $\begingroup$ You could adapt the ideas from stats.stackexchange.com/questions/161745/… $\endgroup$ Commented Nov 30, 2023 at 19:38

0

Your Answer

By clicking “Post Your Answer”, you agree to our terms of service and acknowledge you have read our privacy policy.