I have the following code, which basically try to predict the Species from iris data using randomForest. What I'm really intersed in is to find what are the best features (variable) that explain the species classification. I found the package randomForestExplainer is the best
to serve the purpose.
library(randomForest)
library(randomForestExplainer)
forest <- randomForest::randomForest(Species ~ ., data = iris, localImp = TRUE)
importance_frame <- randomForestExplainer::measure_importance(forest)
randomForestExplainer::plot_multi_way_importance(importance_frame, size_measure = "no_of_nodes")
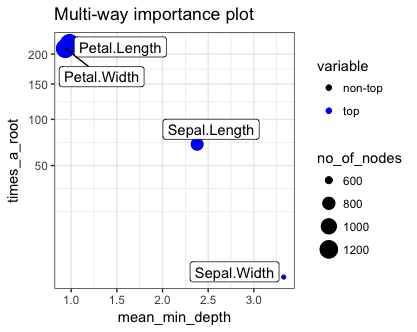
The result of the code produce this plot:
Based on the plot, the key factor to explain why Petal.Length and Petal.Width is the best factor are these (the explanation is based on the vignette):
mean_min_depth– mean minimal depth calculated in one of three ways specified by the parameter mean_sample,times_a_root– total number of trees in which Xj is used for splitting the root node (i.e., the whole sample is divided into two based on the value of Xj),no_of_nodes– total number of nodes that use Xj for splitting (it is usually equal to no_of_trees if trees are shallow),
It's not entirely clear to me why the high times_a_root and no_of_nodes is better? And low mean_min_depth is better?
What are the intuitive explanation for that?
The vignette information doesn't help.

