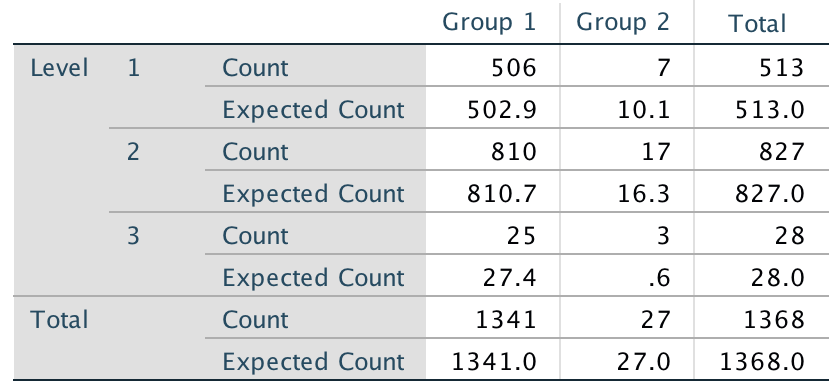
I am analyzing a number of 2x2 and two-by-k tables in a cross-sectional study using Pearson χ2 tests and Fisher’s exact test (or the Fisher-Freeman-Halton exact test) “as appropriate.” Here is a representative example of a two-by-k table:
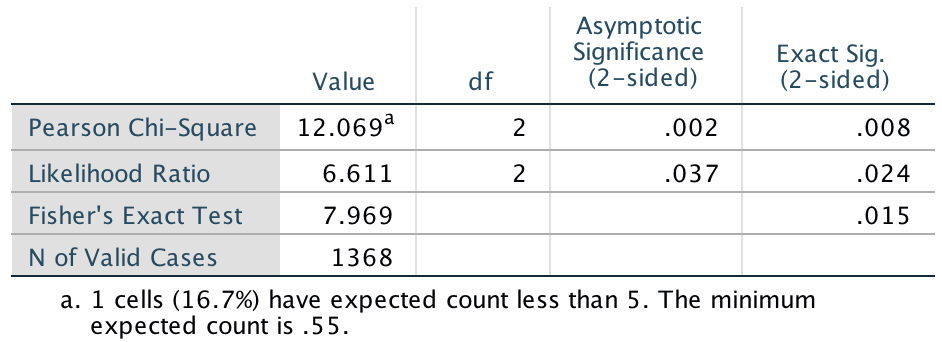
Because of the low expected cell count, I would use the exact test. Here are the statistical tests:
Because the asymptotic and exact p values are quite different, how should I think about this discrepancy? What do you think about the performance of the likelihood ratio chi square (versus Pearson χ2) in this case and under low expected counts more generally?


