3
$\begingroup$

For 86 companies and for 103 days, I have collected (i) tweets (variable hbVol0) about each company and (ii) pageviews for the corporate wikipedia page (wikiVol0). The dependent variable is each company's stock trading volume (stockVol0). My data is structured as follows:

company  date  hbVol0   wikiVol0  stockVol0  comp1  comp2 ... comp86  marketRet
-------------------------------------------------------------------------------
1        1     200        150     2423325      1      0   ...   0     -2.50
1        2     194        152     2455343      1      0   ...   0     -1.45
.        .      .          .         .         .      .   ...   .
1       103    205        103     2563463      1      0   ...   0      1.90
2        1     752        932     7434124      0      1   ...   0     -2.50
2        2     932        823     7464354      0      1   ...   0     -1.45
.        .      .          .         .         .      .   ...   .
.        .      .          .         .         .      .   ...   .
86      103     3          55      32324       0      0   ...   1      1.90

As you can see, the dataset is a pooled cross-sectional time series data. Although other models would be better suited, my thesis coach was OK with me running an OLSon it. After taking the log for stockVol0 and wikiVol0 and taking lag 1 and 2 for all variables, this is one of the best-fitting regressions:
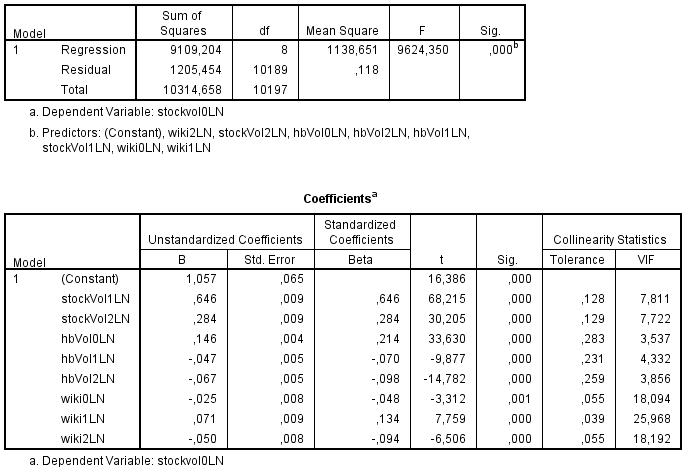
enter image description here

Now, my coach tells me "to do some predictive modelling". Since we have had very little statistics classes, I am unfamiliar with this. My coach told me "to do an easy random forest model", but SPSS (which is the only software I have and am somewhat used to) doesn't have a "random forest" model in it's options. It does support ARIMA, an I have been told it can do forecasting as well. So I tried, but SPSS interprets all (103 x 86) 8,858 rows in the dataset as being unique dates. But there are only 103 days (see date variable in dataset).

Question 1: can anybody tell me how to tell SPSS I have 86 observations for each of the 103 days and not 8,858 dates?

Question 2: am I right that ARIMA is a forecasting model? If not, what is a basic forecasting model that I could apply and/or is random forest available in SPSS under a different name?

P.S. I have asked around among my friends, and 90% of my fellow student graduate without having any predictive modeling in their thesis. It's just that my coach really wants it in there, so a basic model will suffice. I hope some people here can help me on my way since my thesis is due in 2 weeks and I am totally lost here...

$\endgroup$

3 Answers 3

2
$\begingroup$

The first problem I can see is in your data set. You have 86 companies, then how come you have "comp89" in your data set! Probably a typing mistake.
In the above ANOVA table, I cannot see any of the "comp1", or "comp2" ,... as the predictors. Therefore, it seems to me that your ANOVA analysis is free from the type of companies! Then why did you define those dummy variables?
You can do the prediction with OLS in SPSS. You just need to create a new column based on estimated coefficients, something like this.
To answer your 1st question: this is because you have not included any classification variable like "comp1", "comp2" in your ARIMA modeling (same problem as above).
As for your 2nd question: yes indeed ARIMA is a forecasting model.

$\endgroup$
2
  • $\begingroup$ Thanks for your reply. It was indeed a typo. In reality, I added the comp-dummies to the regression, but figured it would only give too long a table (coefficients don't change that much under influence of comp-dummies). I have also day-of-week, day-of-month- and industry to the OLS. When running the ARIMA model including those dummies, I get a result like this: i.imgur.com/5G4zy.png. Please refer to the graph at the bottom: it runs up to says 'date 10300' (I've used my original datset of 100 companies x 103 days here). How can I make SPSS understand this shoudl be up to 103? $\endgroup$
    – Pr0no
    Aug 18, 2012 at 9:21
  • $\begingroup$ Are you sure that you are doing a univariate-time series modeling? I am asking this because at each time point, you have 86 different measurements of your dependent variable (stockVol0). This reminds me a multivariate-time series modeling. I am not sure if SPSS can handle this type of modeling. $\endgroup$
    – Stat
    Aug 19, 2012 at 1:50
3
$\begingroup$

For answering your first question you have to separate your data, simply by using the split file in data.But at first you should create "company name" variable and assign them code from 1 to 86 and repeat 1 for company 1 from 1 to 103 and 2 for company 2 from 1 to 103 and so on.Then follow the below instruction: go to data in spss- select Split File-then select organize output by groups and enter company name which you have already created it -then click OK.

As for your 2nd question: yes indeed ARIMA is a forecasting model. If you use ARIMA forecasting model ,you will have each prediction individually for each company.

$\endgroup$
1
$\begingroup$

@PrOno The company dummy approach just adjusts the intercept reflecting a particular company. What you should be after is a means to test the constancy of all the model parameters not just the intercept. But that is just my opinion.Furthermore your i.imgur.com/5G4zy.png reports no outliers. Can you salute that ?

$\endgroup$
2
  • $\begingroup$ But how will I do that? I have made a dummy variable for each day of the data collection timeframe (day1, day2, day3...day103). Would that help? And yes, the are indeed no outliers. $\endgroup$
    – Pr0no
    Aug 20, 2012 at 12:46
  • 1
    $\begingroup$ @PrOno I discussed an approach stats.stackexchange.com/questions/33923/… . My comment about "no outliers" reflected my incredulity about the analysis that your software reported. $\endgroup$
    – IrishStat
    Aug 20, 2012 at 13:00

Your Answer

By clicking “Post Your Answer”, you agree to our terms of service and acknowledge you have read our privacy policy.

Not the answer you're looking for? Browse other questions tagged or ask your own question.