4
$\begingroup$

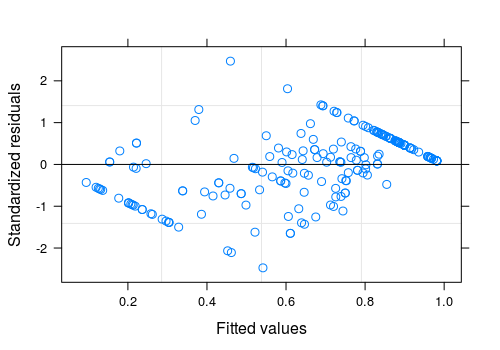
In my particular situation, our outcome variable is recall (bounded between 0 and 1 inclusive), and we are building a linear mixed effects model in R. We end up with a qq plot like the one below:

qq-plot-residuals

Is there anything to do to deal with the bounded outcome variable? Any transformations I make will also be bounded, so I don't see how to get around this. Or is the general idea to just do any transformation I can to get the residuals as close to constant variance as possible, and the shape caused by the bounds isn't a big deal?

Some similar questions:

$\endgroup$
6
  • 2
    $\begingroup$ Why not analyze your data using the zero-one inflated beta regression mixed effects modeling using the glmmTMB package, for example? See cran.r-project.org/web/packages/glmmTMB/vignettes/glmmTMB.pdf. $\endgroup$ Commented May 22, 2018 at 19:25
  • 1
    $\begingroup$ I don't think glmmTMB can do zero-one inflation (only zero-inflation) ? But you could shrink the data a little bit inward to get (0,1) (e.g. see Smithson and Verkuilen's "better lemon-squeezer" paper) $\endgroup$
    – Ben Bolker
    Commented May 22, 2018 at 20:24
  • 2
    $\begingroup$ It looks like you might have discrete denominators in your data (downward-sloping linear features in your residual plot); can you use a binomial model? $\endgroup$
    – Ben Bolker
    Commented May 22, 2018 at 20:25
  • 1
    $\begingroup$ @BenBolker The denominators are discrete; the measure is recall (tp / (tp + fn)). However, each observation (a user, in this case) may have a different number in the denominator, which makes me think that a binomial model cannot be used... Does that sound right to you? (I haven't used binomial models in awhile) $\endgroup$
    – Mikey
    Commented May 22, 2018 at 21:35
  • 2
    $\begingroup$ you absolutely can use a binomial model, and that would be the right thing to do. In lme4 either cbind(tp,fn) ~ ... or tp/(tp+fn) ~ ..., weights=tp+fn) $\endgroup$
    – Ben Bolker
    Commented May 22, 2018 at 22:41

1 Answer 1

8
$\begingroup$

If you really had [0,1] data with no definable denominator, you could use a mixed model with a Beta-distributed response (e.g. in the glmmTMB or brms packages in R), but you would need to do something about the exact 0 and 1 values (which are not feasible for a Beta response - they have likelihood density of either 0 or infinity unless the shape parameters are exactly (1,1)), e.g. shift them slightly toward 0.5 (see e.g. Smithson and Verkuilen Psychological Methods 2006).

However, based on the appearance of your residual plot (discrete linear features) and the comment

the measure is recall (tp / (tp + fn)). However, each observation (a user, in this case) may have a different number in the denominator ...

I would recommend that you use a binomial model. In lme4 (and other R packages) you can either (1) specify the response as a two-column response cbind(success,failure) ~ ... or (2) specify the proportion tp/(tp+fn) ~ ... as the response, and include a weights argument that gives the denominator (tp+fn).

$\endgroup$

Your Answer

By clicking “Post Your Answer”, you agree to our terms of service and acknowledge you have read our privacy policy.

Not the answer you're looking for? Browse other questions tagged or ask your own question.